


机器学习基础教程:使用Python实现无监督学习

人工智能研究的负责人Yan Lecun解释说,非监督式的学习——教机器自己学习,而不用被明确告知他们做的每一件事是对还是错——是实现“真”AI的关键。
监督与无监督学习
在监督学习中,系统试图从之前给出的例子中学习。(在无监督学习中,系统试图直接从给出的例子中找到模式)。因此,如果数据集被标记则监督问题,那么数据集是未标记的,那么它是一个无监督问题。
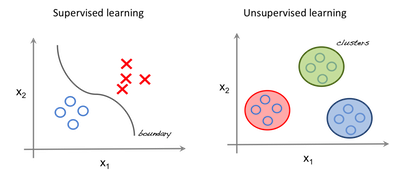
左边的图像是监督式学习的例子;我们使用回归技术来找出特征之间的最佳拟合线。而在无监督学习中,根据特征对输入进行分离,并基于其所属的簇进行预测。
重要术语
特征:用于进行预测的输入变量。
预测:提供输入样本时的模型输出。
样本:数据集的一行。一个样本包含一个或多个特征也可能是标签。
标签:特征的结果。
为无监督学习做准备
在本文中,我们使用Iris数据集(鸢尾花)来进行第一次预测。该数据集包含一组150条记录下5个属性 - 花瓣长度,花瓣宽度,萼片长度,萼片宽度和种类。Iris Setosa,Iris Virginica和Iris Versicolor是这三个类。对于我们的无监督算法,我们给出鸢尾花的这四个特征并预测它属于哪一类。
我们在Python中使用sklearn库来加载Iris数据集,并使用matplotlib来进行数据可视化。以下是为代码片段。
# Importing Modules

from sklearn import datasets

import matplotlib.pyplot as plt


# Loading dataset

iris_df = datasets.load_iris()


# Available methods on dataset

print(dir(iris_df))


# Features

print(iris_df.feature_names)


# Targets

print(iris_df.target)


# Target Names

print(iris_df.target_names)

label = {0: 'red', 1: 'blue', 2: 'green'}


# Dataset Slicing

x_axis = iris_df.data[:, 0]  # Sepal Length

y_axis = iris_df.data[:, 2]  # Sepal Width


# Plotting

plt.scatter(x_axis, y_axis, c=iris_df.target)

plt.show()
['DESCR', 'data', 'feature_names', 'target', 'target_names']

['sepal length (cm)', 'sepal width (cm)', 'petal length (cm)', 'petal width (cm)']

[0 0 0 0 0 0 0 0 0 0 0 0 0 0 0 0 0 0 0 0 0 0 0 0 0 0 0 0 0 0 0 0 0 0 0 0 0 0 0 0 0 0 0 0 0 0 0 0 0 0 1 1 1 1 1 1 1 1 1 1 1 1 1 1 1 1 1 1 1 1 1 1 1 1 1 1 1 1 1 1 1 1 1 1 1 1 1 1 1 1 1 1 1 1 1 1 1 1 1 1 2 2 2 2 2 2 2 2 2 2 2 2 2 2 2 2 2 2 2 2 2 2 2 2 2 2 2 2 2 2 2 2 2 2 2 2 2 2 2 2 2 2 2 2 2 2 2 2 2 2]

['setosa' 'versicolor' 'virginica']
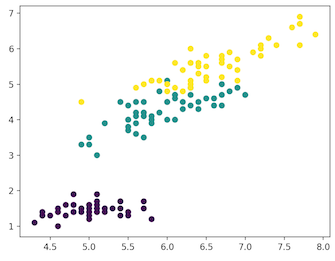
紫罗兰色:Setosa,绿色:Versicolor,黄色:Virginica
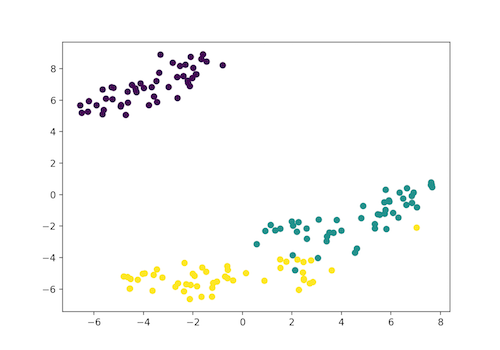
聚类
在聚类中,数据被分成几个组。简单的说,目的是将具有相似特征的群体分开并将它们分配到簇中。
可视化例子:
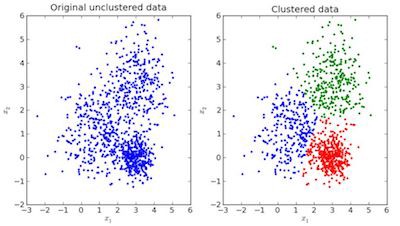
在上图中,左边的图像是没有完成分类的原始数据,右边的图像是聚类的(根据数据的特征对数据进行分类)。当给出要预测的输入时,根据它的特征检查它所属的簇,并进行预测。
Python中的K均值聚类
K均值是一种迭代聚类算法,旨在找到每次迭代中的局部最大值。最初选择所需数量的簇。由于我们知道涉及3个类,因此我们通过将参数“n_clusters”传递到我们的KMeans模型中,将算法编程为将数据分组为3个类。现在随机将三个点(输入)分配到三个簇中。基于每个点之间的质心距离,下一个给定的输入被分离成最近的簇。然后,重新计算所有簇的质心。
簇的每个质心都是定义所得到的组的特征值的集合。检查质心特征权重可以用来定性地解释每个簇代表什么类型的组。
我们从sklearn库导入KMeans模型,拟合特征并预测。
K均值在Python中的实现:
# Importing Modules

from sklearn import datasets

from sklearn.cluster import KMeans


# Loading dataset

iris_df = datasets.load_iris()


# Declaring Model

model = KMeans(n_clusters=3)


# Fitting Model

model.fit(iris_df.data)


# Predicitng a single input

predicted_label = model.predict([[7.2, 3.5, 0.8, 1.6]])


# Prediction on the entire data

all_predictions = model.predict(iris_df.data)


# Printing Predictions

print(predicted_label)

print(all_predictions)
[0]

[0 0 0 0 0 0 0 0 0 0 0 0 0 0 0 0 0 0 0 0 0 0 0 0 0 0 0 0 0 0 0 0 0 0 0 0 0 0 0 0 0 0 0 0 0 0 0 0 0 0 2 2 1 2 2 2 2 2 2 2 2 2 2 2 2 2 2 2 2 2 2 2 2 2 2 2 2 1 2 2 2 2 2 2 2 2 2 2 2 2 2 2 2 2 2 2 2 2 2 2 1 2 1 1 1 1 2 1 1 1 1 1 1 2 2 1 1 1 1 2 1 2 1 2 1 1 2 2 1 1 1 1 1 2 1 1 1 1 2 1 1 1 2 1 1 1 2 1 1 2]
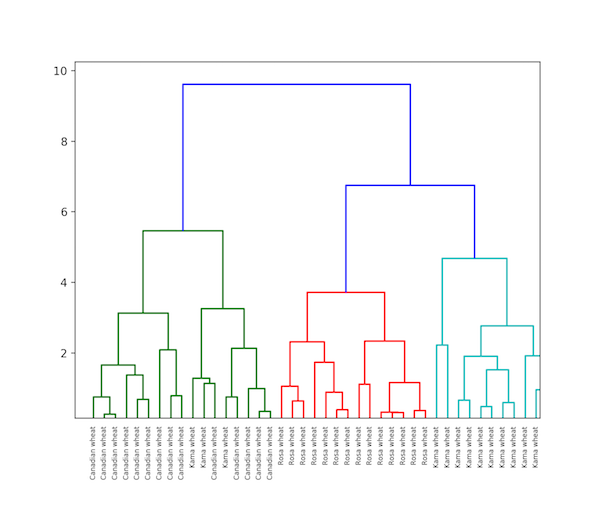
分层聚类
顾名思义,分层聚类是一种构建聚类层次结构的算法。算法从分配给它们自己的集群的所有数据开始。然后将最近的两个簇加入同一个簇。最后,只有剩下一个簇时,该算法才会结束。
层次聚类的完成可以使用树状图来显示。现在让我们看一个谷物数据的层次聚类的例子。数据集可以在这里找到。
数据集:https://raw.githubusercontent.com/vihar/unsupervised-learning-with-python/master/seeds-less-rows.csv
Python中的分层聚类实现:
# Importing Modules

from scipy.cluster.hierarchy import linkage, dendrogram

import matplotlib.pyplot as plt

import pandas as pd


# Reading the DataFrame

seeds_df = pd.read_csv(

    "https://raw.githubusercontent.com/vihar/unsupervised-learning-with-python/master/seeds-less-rows.csv")


# Remove the grain species from the DataFrame, save for later

varieties = list(seeds_df.pop('grain_variety'))


# Extract the measurements as a NumPy array

samples = seeds_df.values


"""

Perform hierarchical clustering on samples using the

linkage() function with the method='complete' keyword argument.

Assign the result to mergings.

"""

mergings = linkage(samples, method='complete')


"""

Plot a dendrogram using the dendrogram() function on mergings,

specifying the keyword arguments labels=varieties, leaf_rotation=90,

and leaf_font_size=6.

"""

dendrogram(mergings,

           labels=varieties,

           leaf_rotation=90,

           leaf_font_size=6,

           )


plt.show()
K均值与分层聚类的区别
- 分层聚类不能很好地处理大数据,但K均值聚类可以。这是因为K均值的时间复杂度是线性阶,即O(n),而层次聚类的时间复杂度是平方阶,即O(n2)。
- 在K均值聚类中,当我们从簇的任意选择开始时,多次运行算法产生的结果可能会有所不同。而结果在分层聚类中可复现。
- 当簇的形状是超球面时(如二维中的圆,三维中的球),K均值工作良好。
- K-Means不允许有噪声的数据,而在分层聚类中,我们可以直接使用有噪声的数据集进行聚类。
t-SNE聚类
t-SNE(t-distributed stochastic neighbor embedding)是用于可视化的无监督学习方法之一。它将高维空间映射到可以可视化的2或3维空间。具体而言,它通过二维点或三维点对每个高维物体进行建模,使得相似的对象由靠近的点建模,而不相似的对象以远离的点建模。
Python中的t-SNE簇的实现:
# Importing Modules

from sklearn import datasets

from sklearn.manifold import TSNE

import matplotlib.pyplot as plt


# Loading dataset

iris_df = datasets.load_iris()


# Defining Model

model = TSNE(learning_rate=100)


# Fitting Model

transformed = model.fit_transform(iris_df.data)


# Plotting 2d t-Sne

x_axis = transformed[:, 0]

y_axis = transformed[:, 1]


plt.scatter(x_axis, y_axis, c=iris_df.target)

plt.show()
紫罗兰色:Setosa,绿色:Versicolor,黄色:Virginica
这里Iris数据集具有四个特征(4d),它被变换并以二维图形表示。类似地,t-SNE模型可以应用于具有n个特征的数据集。
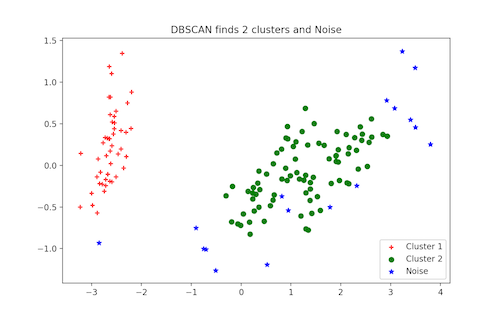
DBSCAN聚类
DBSCAN(Density-Based Spatial Clustering of Applications with Noise)是一种流行的聚类算法,用作预测分析中K均值的替代。它不要求您输入簇的数量才能运行。但你必须调整其他两个参数。
scikit-learn提供了eps和min_samples参数的默认值,但一般我们会调整这些参数。eps参数是在同一邻域中考虑的两个数据点之间的最大距离。min_samples参数是被认为是簇的邻域中的最小数据点数量。
Python中的DBSCAN聚类:
# Importing Modules

from sklearn.datasets import load_iris

import matplotlib.pyplot as plt

from sklearn.cluster import DBSCAN

from sklearn.decomposition import PCA


# Load Dataset

iris = load_iris()


# Declaring Model

dbscan = DBSCAN()


# Fitting

dbscan.fit(iris.data)


# Transoring Using PCA

pca = PCA(n_components=2).fit(iris.data)

pca_2d = pca.transform(iris.data)


# Plot based on Class

for i in range(0, pca_2d.shape[0]):

    if dbscan.labels_[i] == 0:

        c1 = plt.scatter(pca_2d[i, 0], pca_2d[i, 1], c='r', marker='+')

    elif dbscan.labels_[i] == 1:

        c2 = plt.scatter(pca_2d[i, 0], pca_2d[i, 1], c='g', marker='o')

    elif dbscan.labels_[i] == -1:

        c3 = plt.scatter(pca_2d[i, 0], pca_2d[i, 1], c='b', marker='*')


plt.legend([c1, c2, c3], ['Cluster 1', 'Cluster 2', 'Noise'])

plt.title('DBSCAN finds 2 clusters and Noise')

plt.show()
更多无监督技术:
- PCA
- 异常检测
- 自编码器
- 深度信念网络
- 赫布学习(hebbian learning)
- GAN
- 自组织映射