图与矢量RAG:基准测试、优化手段和财务分析示例
Neo4j和WhyHow.AI的团队探讨了图和矢量搜索系统如何共同改进检索增强生成(RAG)系统。通过一个财务报告 RAG 示例,我们探讨了图搜索和矢量搜索在响应方面的差异,对两种类型的答案输出进行了基准测试,展示了如何通过图结构优化深度和广度,并发现了为什么将图搜索和矢量搜索结合起来是 RAG 的未来。
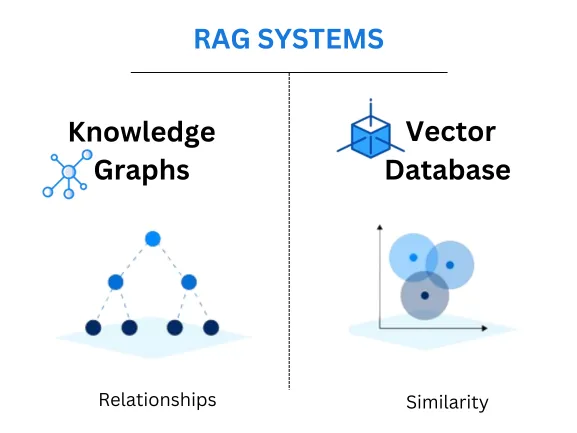
Neo4j 等图形数据库是基于图形的概念建立的:图形是节点和关系的集合。节点代表单个数据点,而关系则定义它们之间的联系。每个节点都可以拥有属性,这些属性是键值对,提供节点的附加上下文或属性。这种方法提供了一种灵活、直观的方式来模拟数据中的复杂关系和依赖关系。知识图谱经常被称为类似于人类大脑的工作方式。知识图谱可以存储和查询明确的关系,从而减少幻觉,并通过上下文注入提高准确性。
知识图谱存储数据和数据点之间的联系,通过提供所有相关信息的综合视图来增强推理和提取能力。这也带来了可解释性的好处,因为图中所依赖的数据是可见和可追溯的。
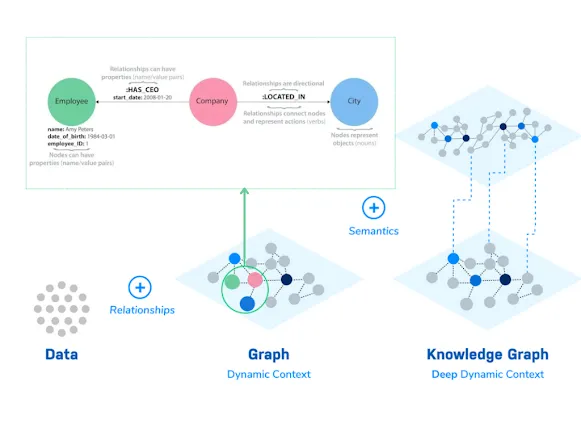
这种能力对金融分析等领域尤其有益,因为在这些领域,理解金融指标、市场条件和业务实体之间错综复杂的关系至关重要。
例如,图形数据库可以在一个反映真实世界互动的连贯模型中连接各种信息,如执行报表、财务结果和市场条件。这样,财务分析师就可以通过浏览图表来了解直接和间接的影响,从而探索复杂的情景,如宏观经济变化对特定产品线的影响。使用 Neo4j 的图形查询语言 Cypher,我们可以发现知识图谱中错综复杂的关系,例如影响者对产品的影响:
def explore_impact_on_product(graph, product_name):
    query = """
    MATCH (p:Product {name: $product_name})<-[r:IMPACTS]-(m)
    RETURN m.name AS Influencer, r.description AS ImpactDescription
    """
    result = graph.run(query, product_name=product_name)
    for record in result:
        print(f"Influencer: {record['Influencer']}, Impact: {record['ImpactDescription']}")
在业务场景中,决策者可以看到孤立数据点之间的联系。图形可以说明供应商动态变化如何影响生产计划、库存水平和财务结果。图形结构的灵活性使其能够随着新数据类型和关系的引入而动态调整,而无需对底层数据库模式进行重大的重新设计。
使用深度和广度图搜索
矢量搜索通常用于 RAG,可查找语义相似的单词和短语,并将该信息返回给 LLM,以构建问题的答案。矢量搜索是一种强大的方法,它可以带来与问题相关的某些信息类型。例如,围绕 “约翰养了哪些宠物?”的问题可以检索到有关约翰的猫或狗的信息,因为可以推导出 “猫 ”和 “狗 ”在语义上可能与 “宠物 ”相似。这意味着在检索之前,这些词不必明确地与 “宠物 ”概念联系在一起。然而,许多信息可能语义相似但不相关,或者相关但语义不相似。
图谱搜索提供了特定的杠杆和模式,可对其进行优化,以便在信息检索中实现更大的细粒度控制。对于需要在特定查询方向内进行更深层次信息检索的查询,图形可以方便地浏览各层关系,从而对特定模式进行深入分析。相反,对于需要从更广阔的视角来了解数据和关注整体信息范围的查询,图形可以允许在广泛的相邻关系中进行检索。
通过财务报告 RAG 评估图和矢量搜索
让我们以苹果公司的季度财务报告为例,探讨图和矢量搜索在财务信息检索系统中的应用。
财务分析师需要处理有关公司业绩、市场趋势和产品见解的复杂查询。例如,分析师的任务是评估几个季度以来汇率对 iPhone 收入的影响。这样的问题需要了解产品性能、财务状况和外部经济因素。
知识图谱将收益电话记录转换成结构化格式,概述财务指标、产品和市场条件之间的关系,从而提供公司业绩的全面视图。通过这种结构化的方法,分析师可以进行快速、精确的分析,深入了解不同业务部门之间如何相互作用和相互影响,从而加强战略投资决策。通过图表结构,你可以直接提取关键数据实体及其相邻实体。
下面的代码允许我们获取一个实体的名称,检索其邻近实体(相关节点)并安装依赖关系:
pip install numpy pyvis neo4j openai

from neo4j import GraphDatabase
from typing import Optional, Union, List, Dict
import numpy as np
from openai import OpenAI
from pyvis.network import Network

def get_embedding(text, model="text-embedding-3-small"):
    client = OpenAI()
    text = text.replace("\n", " ")

    return client.embeddings.create(input = [text], model=model).data[0].embedding

def calculate_similarity(embedding1, embedding2):
    # Placeholder for similarity calculation, e.g., using cosine similarity
    # Ensure both embeddings are numpy arrays for calculation
    return np.dot(embedding1, embedding2) / (np.linalg.norm(embedding1) * np.linalg.norm(embedding2))

class NodeSimilaritySearchMan():

    def __init__(self, neo4j_driver: GraphDatabase):
        """
        Initialize the NodeSimilaritySearchMan with a Neo4j driver instance.

        Args:
            neo4j_driver (GraphDatabase): The Neo4j driver to facilitate connection to the database.
        """
        self.driver = neo4j_driver

    def find_relationship_neighbors(self, node_name: str) -> List[Dict[str, Union[int, str]]]:
        """
        Finds neighbors of a given node based on direct relationships in the graph.

        Args:
            node_name (str): The name of the node for which to find neighbors.

        Returns:
            List[Dict[str, Union[int, str]]]: A list of dictionaries, each representing a neighbor with its ID and name.
        """

        result = self.driver.execute_query(
            """
            MATCH (n)-[r]->(neighbor)
            WHERE n.name = $node_name
            RETURN  neighbor.name AS name,
                type(r) AS relationship_type
            """,
            {"node_name": node_name}
        )

            neighbors = [{ "name": record["name"],
                        "relationship_type": record["relationship_type"]} for record in result]
        return neighbors

    def visualize_relationship_graph_interactive(self,neighbors, node_name,graph_name, edge_label='relationship_type'):
        # Initialize the Network with cdn_resources set to 'remote'
        net = Network(notebook=True, cdn_resources='remote')

        # Add the main node
        net.add_node(node_name, label=node_name, color='red')

        # Add neighbors and edges to the network
        for neighbor in neighbors:
            title = neighbor.get('neighbor_chunks_summary', '')
            if edge_label == 'similarity':  # Adjust title for similarity
                title += f" (Similarity: {neighbor[edge_label]})"
            else:
                title += f" ({edge_label}: {neighbor[edge_label]})"
            net.add_node(neighbor['name'], label=neighbor['name'], title=title)
            net.add_edge(node_name, neighbor['name'], title=str(neighbor[edge_label]))

        net.show(f'{graph_name}_graph.html')
        return net
我们检索与 “苹果 ”相关的节点:
driver = GraphDatabase.driver(uri=url,auth=(user,password))
query_obj = NodeSimilaritySearchMan(driver)
neighbors_by_relationship = query_obj.find_relationship_neighbors("Apple")
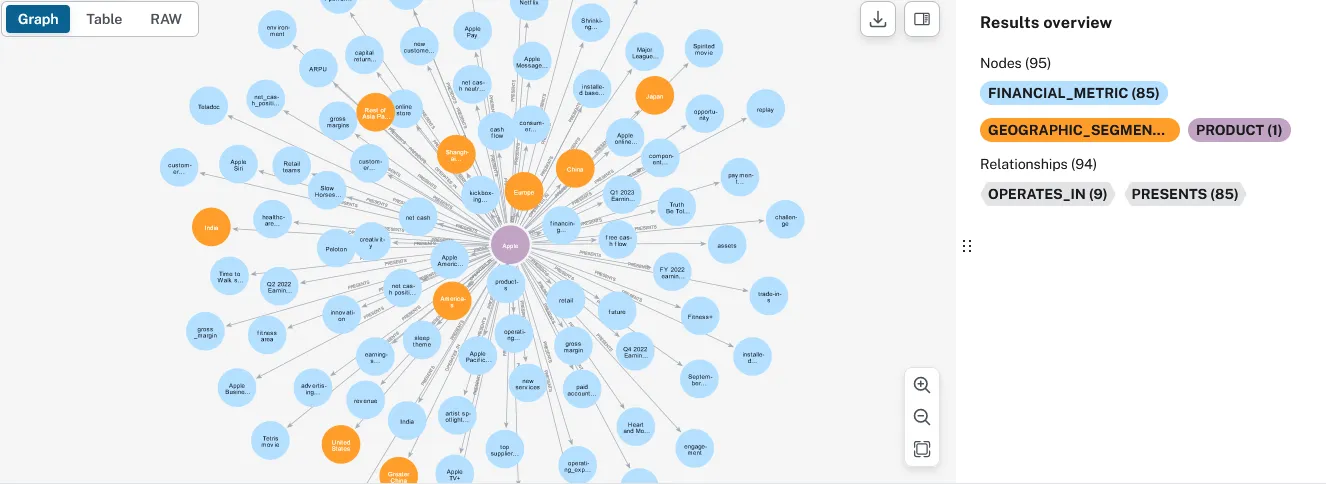
为了理解图形搜索和矢量搜索之间的区别,我们将使用WhyHow.AI SDK来生成知识图谱,因为它允许我们直接从PDF文件生成知识图谱。WhyHow SDK是一款功能强大的工具,旨在简化知识图谱的构建。该SDK允许用户高效地创建、管理和查询范围广泛的知识图谱,使企业能够以他们关心的方式组织和使用数据。
利用WhyHow SDK,用户可以根据预定义的模式构建知识图谱。在这种情况下,模式通过指定相关实体(节点)的类型、连接这些实体的关系(边)类型以及这些关系应遵循的模式,来定义知识图谱的结构。这种方法提供了高度的控制能力,允许用户根据自己的具体需求定制知识图谱,确保图谱准确反映原始数据中的内在关系。
通过定义模式,用户可以准确指定知识图谱应包含的元素和连接。这可能包括从文学分析中的人物和对象到商业应用中的产品和用户交互等任何内容。模式可确保构建的图谱与定义的上下文保持一致和相关性,使其成为从复杂文档中提取有意义见解的强大工具。
首先,我们初始化 WhyHow 客户端,并将我们希望在图中表示的文档添加到命名空间:
from whyhow import WhyHow
import os
from dotenv import load_dotenv
load_dotenv()

user = os.getenv("NEO4J_USERNAME")
password = os.getenv("NEO4J_PASSWORD")
url = os.getenv("NEO4J_URL")

client = WhyHow(neo4j_user=user,neo4j_password=password,neo4j_url=url)

# Define namespace name
namespace = "apple-earning-calls"

documents = [
     "earning-calls-apple/Apple (AAPL) Q1 2023 Earnings Call Transcript _ The Motley Fool.pdf",
    "earning-calls-apple/Apple (AAPL) Q2 2022 Earnings Call Transcript _ The Motley Fool.pdf",
    "earning-calls-apple/Apple (AAPL) Q4 2022 Earnings Call Transcript _ The Motley Fool.pdf"
]

# Add documents to your namespace
documents_response = client.graph.add_documents(
  namespace = namespace, documents = documents
)
其次,我们为图表定义所需的模式:
{
  "entities": [
    {
      "name": "Company",
      "description": "The company discussed in the document, specifically Apple Inc."
    },
    {
      "name": "Financial_Metric",
      "description": "Quantitative measures of Apple's financial performance, including revenue, gross margin, operating expenses, net cash position, etc."
    },
    {
      "name": "Product",
      "description": "Physical goods produced by Apple, such as iPhone, Mac, iPad, Apple Watch."
    },
    {
      "name": "Service",
      "description": "Services offered by Apple, including Apple TV+, Apple Music, iCloud, Apple Pay."
    },
    {
      "name": "Geographic_Segment",
      "description": "Market areas where Apple operates, such as Americas, Europe, Greater China, Japan, Rest of Asia Pacific."
    },
    {
      "name": "Executive",
      "description": "Senior leaders of Apple who are often quoted or mentioned in earnings calls, like CEO (Tim Cook), CFO (Luca Maestri)."
    },
    {
      "name": "Market_Condition",
      "description": "External economic or market factors affecting Apple's business, such as inflation, foreign exchange rates, geopolitical tensions."
    },
    {
      "name": "Event",
      "description": "Significant occurrences influencing the company, including product launches, earnings calls, and global or regional economic events."
    },
    {
      "name": "Time_Period",
      "description": "Specific time frames discussed in the document, typically fiscal quarters or years."
    }
  ],
  "relations": [
    {
      "name": "Reports",
      "description": "An executive discusses specific financial metrics, typically during an earnings call."
    },
    {
      "name": "Impacts",
      "description": "Describes the influence of events or market conditions on financial metrics, products, services, or geographic segments."
    },
    {
      "name": "Operates_In",
      "description": "Denotes the geographic areas where Apple's products and services are available."
    },
    {
      "name": "Presents",
      "description": "Associates products or services with their financial performance metrics, as presented in earnings calls or official releases."
    },
    {
      "name": "Occurs_During",
      "description": "Connects an event with the specific time period in which it took place."
    },
    {
      "name": "Impacted_By",
      "description": "Shows the effect of one entity on another, such as a financial metric being impacted by a market condition."
    },
    {
      "name": "Offers",
      "description": "Indicates that the company provides certain services."
    },
    {
      "name": "Influences",
      "description": "Indicates the effect of strategies or innovations on various aspects of the business."
    }
  ],
  "patterns": [
    {
      "head": "Executive",
      "relation": "Reports",
      "tail": "Financial_Metric",
      "description": "An executive reports on a financial metric, such as revenue growth or operating margin."
    },
    {
      "head": "Event",
      "relation": "Impacts",
      "tail": "Financial_Metric",
      "description": "An event, like a product launch or economic development, impacts a financial metric."
    },
    {
      "head": "Product",
      "relation": "Presents",
      "tail": "Financial_Metric",
      "description": "A product is associated with specific financial metrics during a presentation, such as sales figures or profit margins."
    },
    {
      "head": "Product",
      "relation": "Operates_In",
      "tail": "Geographic_Segment",
      "description": "A product is available in a specific geographic segment."
    },
    {
      "head": "Event",
      "relation": "Occurs_During",
      "tail": "Time_Period",
      "description": "An event such as an earnings call occurs during a specific fiscal quarter or year."
    },
    {
      "head": "Financial_Metric",
      "relation": "Impacted_By",
      "tail": "Market_Condition",
      "description": "A financial metric is affected by a market condition, such as changes in foreign exchange rates."
    },
    {
      "head": "Company",
      "relation": "Offers",
      "tail": "Service",
      "description": "Apple offers a service like Apple Music or Apple TV+."
    },
    {
      "head": "Service",
      "relation": "Influences",
      "tail": "Market_Condition",
      "description": "A service influences market conditions, potentially affecting consumer behavior or competitive dynamics."
    }
  ]
}
然后我们使用刚刚定义的模式来生成图表:
schema = "../schemas/earnings_schema.json"
extracted_graph = client.graph.create_graph_from_schema(
  namespace = namespace, schema_file = schema
)
print("Extracted Graph:", extracted_graph)
在 Neo4j 实例中,我们可以看到正在创建的图表如下。
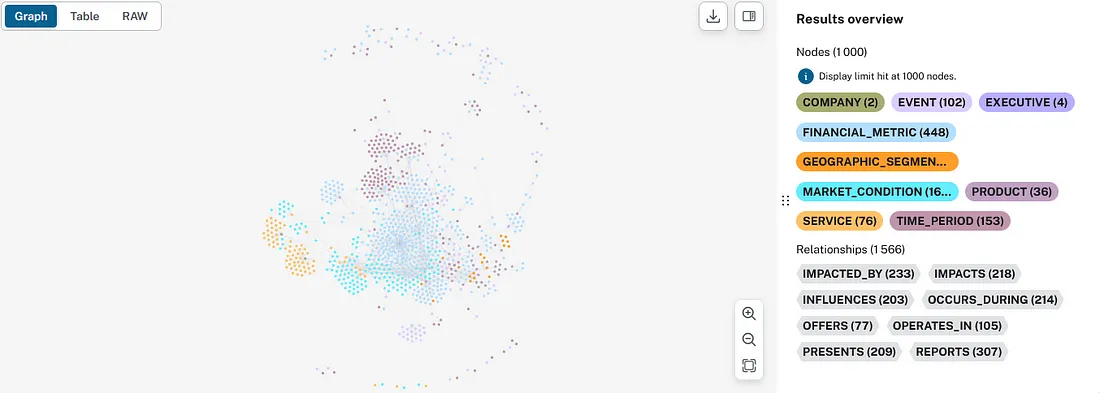
节点和关系分别是模式中定义的实体和关系,而模式则是构成我们观察到的图的实际关系。
同时,我们还定义了一个检索链,它使用向量索引将相同的文档存储为向量表示,并使用 GPT-4 模型对这些文档进行问题解答。我们还实现了来自 Cohere 的 Rerank,以优化检索管道:
from langchain_community.document_loaders import PyPDFLoader
from langchain_openai import OpenAIEmbeddings
from langchain_community.vectorstores import FAISS
from langchain_openai import OpenAIEmbeddings
from langchain_core.output_parsers import StrOutputParser
from langchain_core.runnables import RunnablePassthrough
from langchain_openai import OpenAIEmbeddings
from langchain import hub
from langchain_openai import ChatOpenAI
from langchain_community.document_loaders import PyPDFDirectoryLoader
from langchain.retrievers.document_compressors import FlashrankRerank
from langchain.retrievers import ContextualCompressionRetriever
import os
from langchain import PromptTemplate, LLMChain
from langchain_cohere import CohereRerank
from cohere import Client
from dotenv import load_dotenv
load_dotenv()
cohere_api_key = os.getenv("COHERE_API_KEY")
co = Client(cohere_api_key)
class CustomCohereRerank(CohereRerank):
    class Config():
        arbitrary_types_allowed = True
CustomCohereRerank.update_forward_refs()
def format_docs(docs):
    return "\n\n".join(doc.page_content for doc in docs)
def query_vector_db(query,faiss_index):

    retriever = faiss_index.as_retriever()
    compressor = CustomCohereRerank(client=co)
    compression_retriever = ContextualCompressionRetriever(
    base_compressor=compressor, base_retriever=retriever
    )
    template = """You are a helpful assistant who is able to answer any question using the provided context. Answer the question using just the context provided to you
    question: {question}
    context: {context}
    Provide a concise response with maximum three sentences"""
    prompt = PromptTemplate(template=template,
                            input_variables=["context","question"])
    llm = ChatOpenAI(model="gpt-4")
    rag_chain = LLMChain(prompt=prompt,llm=llm)
    docs = compression_retriever.invoke(query)
    context = format_docs(docs)
    answer = rag_chain.invoke({"question":query,"context":context})
    return answer
def index_docs_vectordb(path):

    loader = PyPDFDirectoryLoader(path)
    pages = loader.load_and_split()
    faiss_index = FAISS.from_documents(pages, OpenAIEmbeddings())
    return faiss_index
# index docs
path = "earning-calls-apple" # the path to the folder containing the PDF documents
index = index_docs_vectordb(path)
最后,我们定义了两个函数--query_vectordb 和 query_graph,分别用于查询向量存储和图:
def query_vectordb(query):
    answer = query_vector_db(query,index)
    return answer
def query_graph(query,namespace):
    query_response = client.graph.query_graph(namespace, query)
    return query_response.answer
图形和矢量查询的答案完整性和局限性
完整性是指系统在不遗漏重要细节的情况下提供查询的所有相关信息的能力。由于其关系性质,图数据库可以通过对所有相互关联的数据进行详尽搜索来提供全面的答案。相反,矢量索引虽然能高效地找到相似的文本块,但可能并不总能捕捉到更广泛的上下文或数据点之间相互关系的完整视图。想象一下,我们需要全面了解直接影响苹果公司 Mac 产品线的所有市场条件。这可能包括经济因素、供应链问题、竞争态势等。我们可以定义一个 GraphQueryManager 类来检索这些信息:
from neo4j import GraphDatabase
class GraphQueryManager:
    def __init__(self, uri, user, password):
        self.driver = GraphDatabase.driver(uri, auth=(user, password))
    def close(self):
        self.driver.close()
    def get_impacting_market_conditions(self, product_name):
        with self.driver.session() as session:
            result = session.run("""
            MATCH (n)-[r:IMPACTS]->(m) WHERE m.name=$product_name AND n.namespace="apple-earning-calls"
            RETURN n.name as Condition, r.description as Description, m.name as Product
            """, product_name=product_name)
            return [{"Condition": record["Condition"], "Description": record["Description"], "Product": record["Product"]} for record in result]
# Usage
graph_manager = GraphQueryManager(url, "neo4j", password)
conditions = graph_manager.get_impacting_market_conditions("Mac")
graph_manager.close()
当我们查询图表时,我们会检索影响 Apple Mac 的所有市场条件,这样我们就可以将与该产品相关的所有市场条件都包括在内。这将产生以下市场条件列表:
for condition in conditions:
print(f"- {condition['Condition']}","\n")
- COVID-19
- foreign exchange
- macro environment
- macroeconomic outlook
- Market Condition
- product
- services
- softening macro
- PC industry
- iPhone
- revenue
- silicon shortage
- strong March results
- product launch
- sellout conditions
- tightness in the supply chain
- COVID disruptions
- foreign currency
- market condition
- macroeconomic headwinds
- macroeconomic outlook
- COVID-related impacts
- FX headwinds
- digital advertising
- gaming
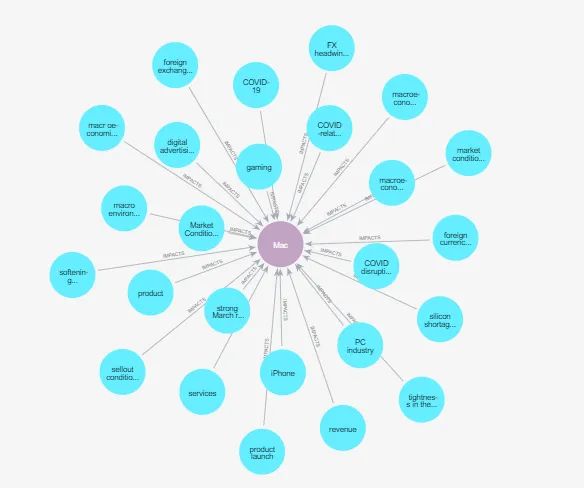
根据图数据库中的结构关系,每个项目都被标记为对 Mac 有影响。这种直接联系确保了信息的相关性,并能精确地针对查询的意图。
在我们基于矢量存储的链上运行相同的查询,可能会得到不那么完整的答案:
vectordb_conditions = query_vectordb(
"what are the market conditions that impact Mac products?")
print(vectordb_conditions)
影响 Mac 产品的市场条件包括外汇逆风、重大供应限制和宏观经济环境。
与图表搜索不同,矢量搜索无法从本质上理解或传达不同市场条件之间的关系及其对 Mac 的影响。它提供的文本块必须经过进一步分析才能理解其中的联系。这意味着在分析过程中可能会忽略重要信息,从而导致答案长期不一致。如果没有一个基于关系的结构来突出和列举一系列全面的相关概念,就很难通过矢量搜索生成完整的答案。
不过,纯图形搜索也有局限性。图将文本的基本信息简化为三元组(即实体-关系-实体)。这种对信息的简化和抽象有可能会丢失一些基础上下文。
将基于图和矢量的搜索合并,使用图结构来发现相关的矢量块,是将确定性导航与上下文感知矢量块数据存储和检索相结合的一种好方法。下面是一个例子,Neo4j关于基于图的元数据过滤的文章对此有进一步解释。
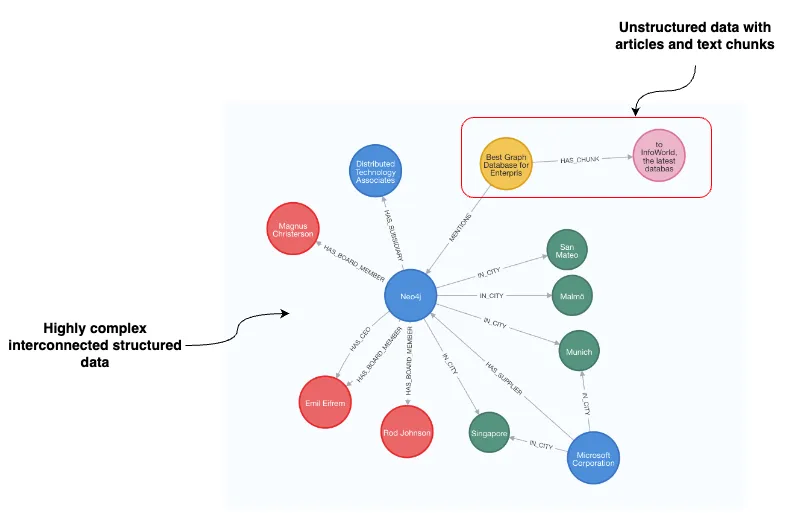
“Neo4j 联合创始人兼首席执行官 Emil Eifrem 说:”我们认为,将矢量揭示的隐式关系与图形揭示的显式事实关系和模式相结合很有价值。"客户在使用生成式人工智能进行创新时,也需要相信他们的部署结果是准确、透明和可解释的。
深度问题
在Neo4j中实现深度参数为分析图数据库中的复杂关系提供了一种机制。在下面的代码片段中,我们运行一个查询来检索蒂姆-库克(Tim Cook)报告的财务指标以及影响这些指标的市场条件。
深度参数在 Cypher 查询的关系模式中指定。在本例中,深度参数由 [:REPORTS] 和 [:IMPACTED_BY] 关系中的 *1...20 范围表示。该范围表示从起始节点(“高管”)到目标节点(“财务指标 ”和 “市场状况”)的最小和最大跳数(或关系):
MATCH path = (exec:EXECUTIVE)-[:REPORTS*1..20]->
(metric:FINANCIAL_METRIC)-[:IMPACTED_BY*1..20]->(cond:MARKET_CONDITION)
WHERE exec.name='Tim Cook'
RETURN exec, metric, cond, path
反过来,我们会得到下面的子图。
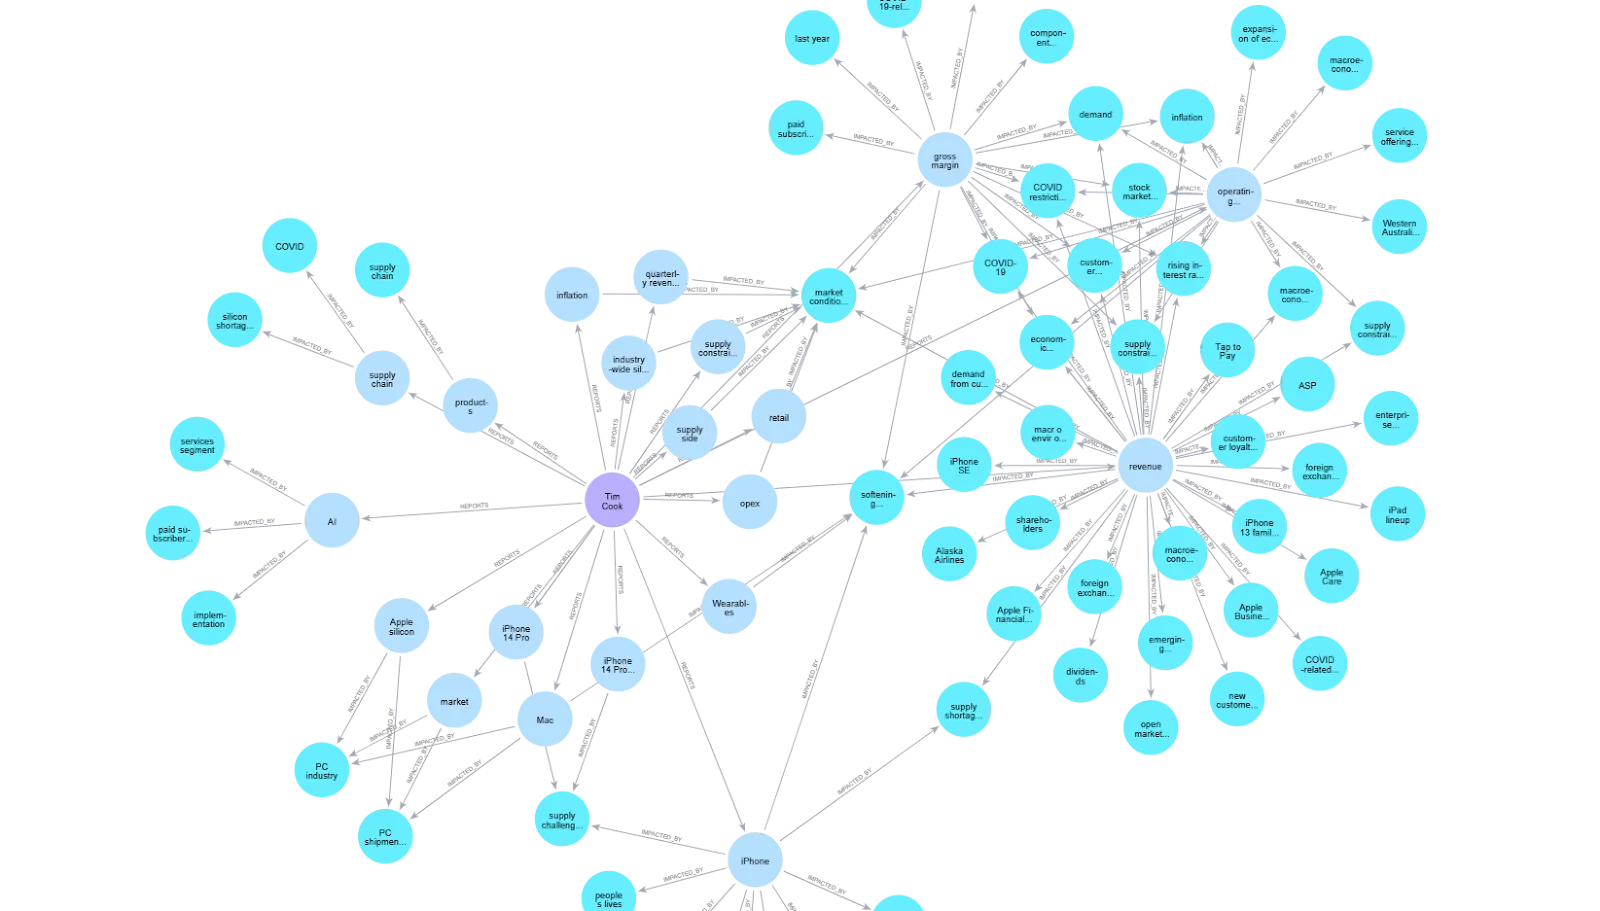
通过探索我们指定的图搜索深度,该图显示了与我们的查询相关的相互关联的实体。我们还可以注意到,利用WhyHow SDK构建的图表查询返回的结果,该图表能够浏览面向深度的问题,同时利用最新的块链接功能,我们可以检索与图表中节点相关的块。
from langchain.chat_models import ChatOpenAI
from langchain import PromptTemplate, LLMChain
OPENAI_API_KEY = os.getenv("OPENAI_API_KEY")
def run_chain(question,txt_context):
    template = """ You are a helpful assistant who is able to answer any question using the provided context. Answer the question using just the context provided to you
    Question : {question},
    Context:{context}
    Provide a concise response with maximum three sentences"""
    prompt = PromptTemplate(template=template,
                            input_variables=["context","question"])
    # load the model
    chat = ChatOpenAI(model_name="gpt-4",openai_api_key=OPENAI_API_KEY, temperature=0.0)
    chain = LLMChain(llm=chat, prompt=prompt)
    answer = chain.invoke({"question":question,'context':txt_context})
def query_graph_with_chain(question):
    context = client.graph.query_graph(
    query = question,
    namespace = "apple-earning-calls",
    include_chunks = True
    )
    txt_context = context.answer
    txt = " "
    for chunk in context.chunks:
        for text in chunk.chunk_texts:
            txt += text
    txt_context += txt
    chain_answer = run_chain(question,txt_context)
    return chain_answer['text']
gr = query_graph_with_chain(question['question'])
vc = query_vector_db(question['question'],index)
print("Graph: ", gr)
print("Vector: ", vc['text'])
广度问题
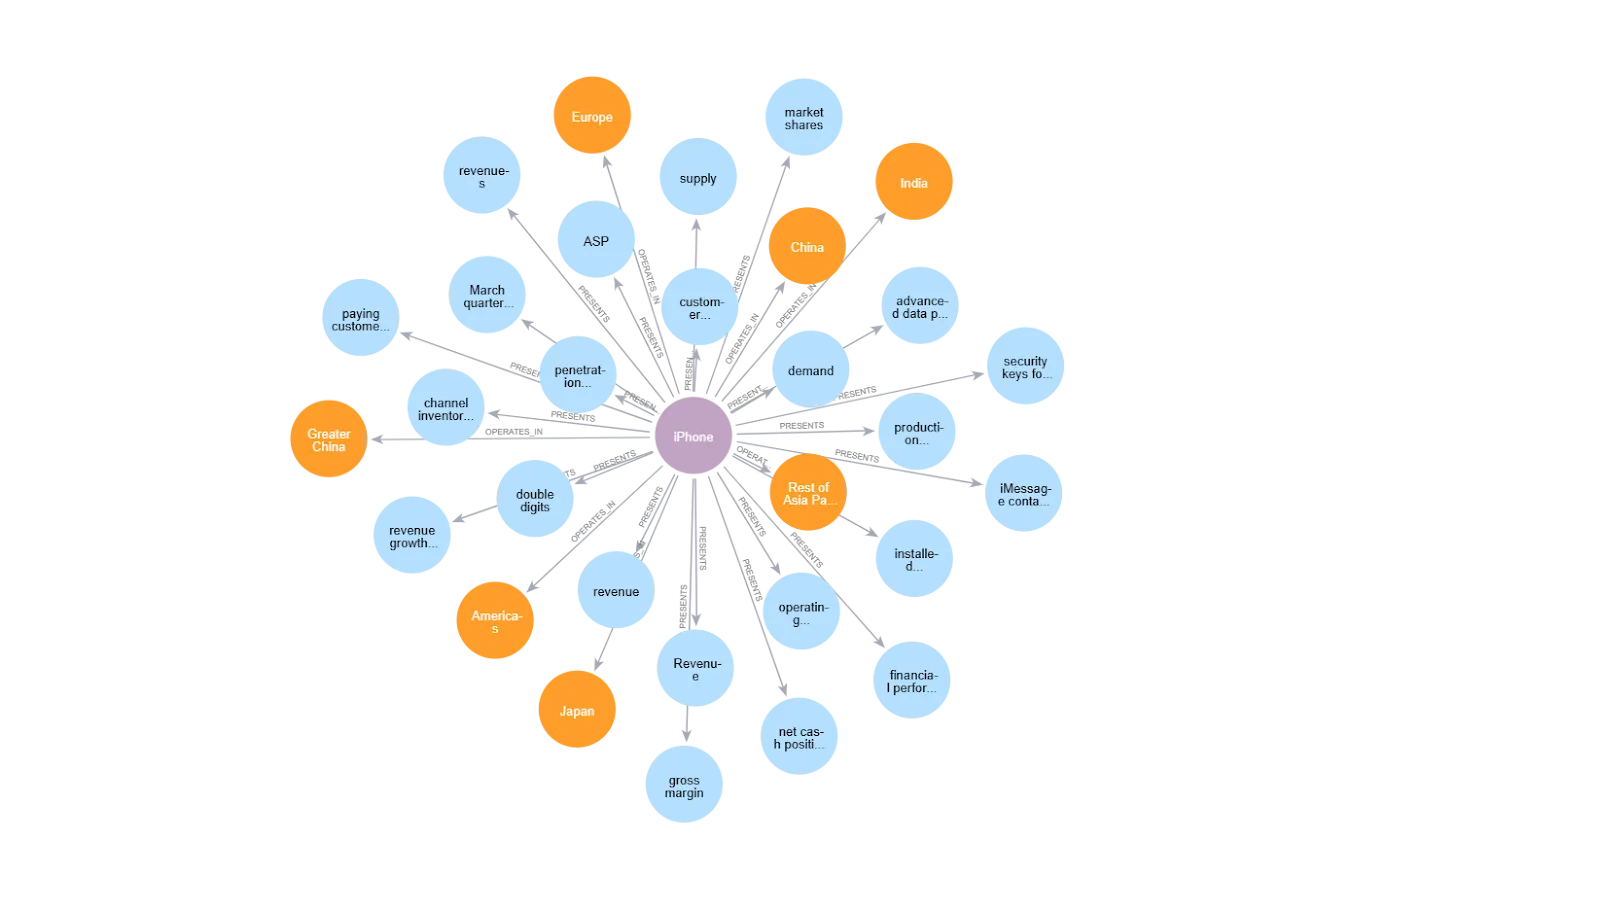
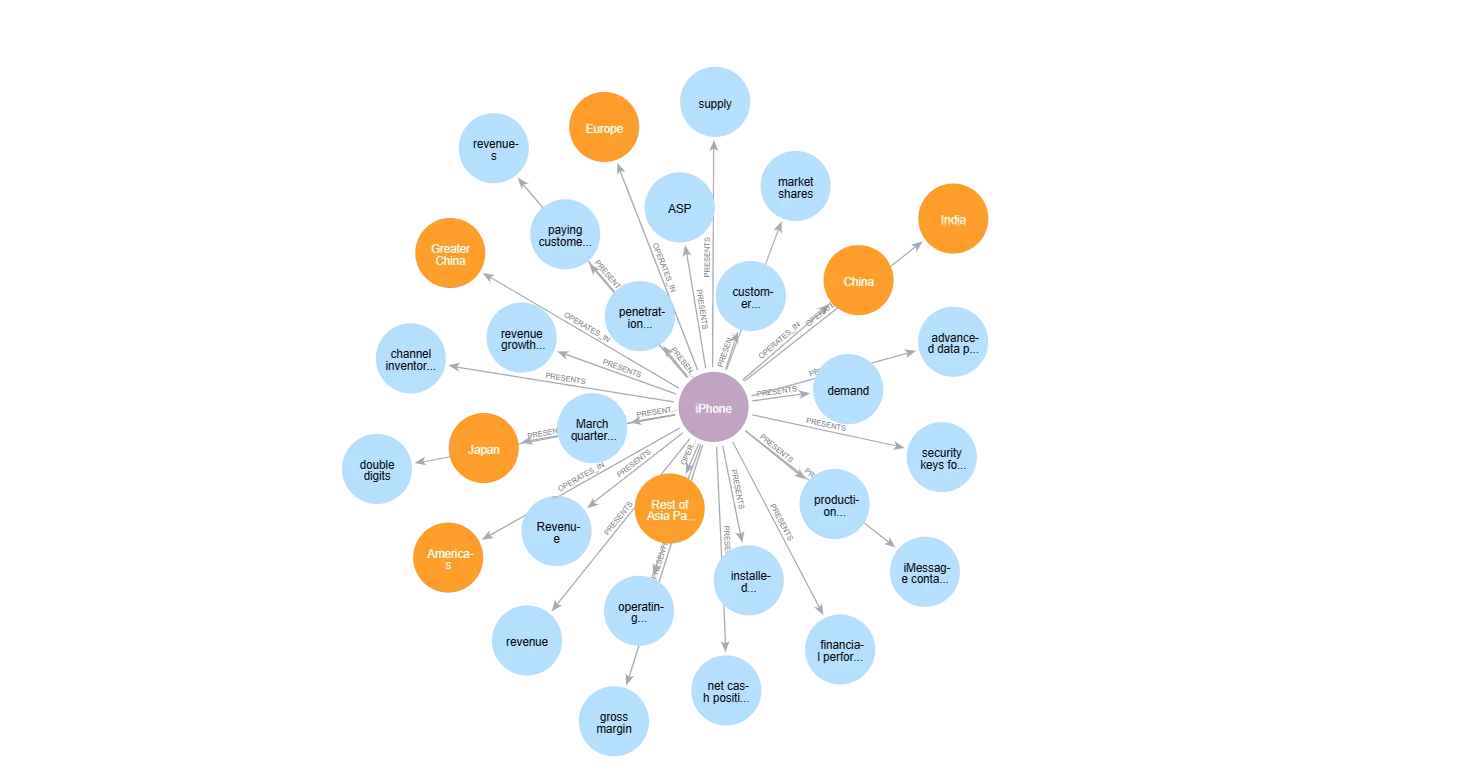
广度问题要求对某一特定主题相关的各种概念进行广泛的概述,并从中提取见解。在图查询中控制广度意味着我们可以扩大或缩小搜索范围。这样,我们就能回答需要探索节点周围直接连接的问题,向外扩展,查看起始节点与多少个不同节点或节点类型直接相连。
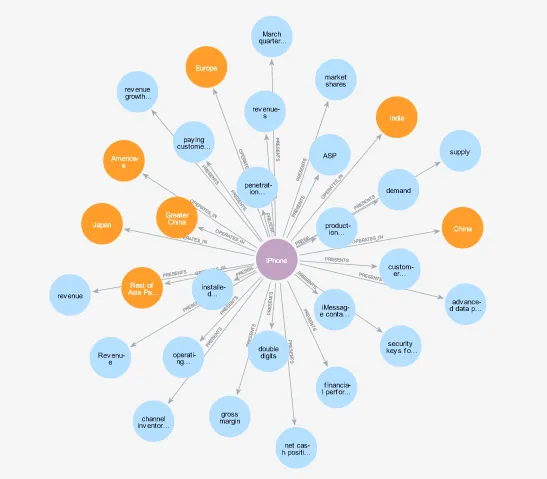
在此图中,你可以将这些信息输入到 LLM 中进行后处理,并通过语义相似性查找、确定我们要跟踪的特定关系类型或特定节点类型来确定哪些数据点最相关。
例如,如果通过关系类型
MATCH (n:PRODUCT)-[r]->(m)
WHERE n.name="iPhone"
RETURN n, r, m
或根据节点类型:
MATCH (n:PRODUCT)-[r]->(m)
WHERE (m:GEOGRAPHIC_SEGMENT OR m:FINANCIAL_METRIC) AND n.name="iPhone"
RETURN n, r, m
深度和广度问题
需要探索图表深度和广度的问题经常会在现实世界中遇到。这些问题需要了解深层次的概念信息,以及这些信息与其他概念之间的关系。
图形数据库允许我们在图形查询中结合两种类型的搜索,从而更轻松地检索具有丰富洞察力的复杂子图。
在我们的使用案例中,假设我们想了解苹果公司的战略决策如何影响其在一系列季度中不同地区的财务指标,以及这些指标如何影响产品开发战略。我们可以构建一个图查询来表示这些实体之间的相互关联关系:
MATCH (exec:EXECUTIVE)-[r1:REPORTS]->(metric:FINANCIAL_METRIC),
(metric)-[r2:IMPACTED_BY]->(cond:MARKET_CONDITION),
(prod:PRODUCT)-[r3:PRESENTS]->(metric),
(prod)-[r4:OPERATES_IN]->(geo:GEOGRAPHIC_SEGMENT),
(event:EVENT)-[r5:OCCURS_DURING]->(time:TIME_PERIOD),
(event)-[r6:IMPACTS]->(metric)
WHERE exec.name IN ['Tim Cook', 'Luca Maestri'] AND
geo.name IN ['Americas', 'Europe', 'Greater China'] AND
time.name IN ['Q1 2023', 'Q2 2023', 'Q3 2023']
RETURN exec, metric, cond, prod, geo, event, time, r1,r2,r3,r4,r5,r6
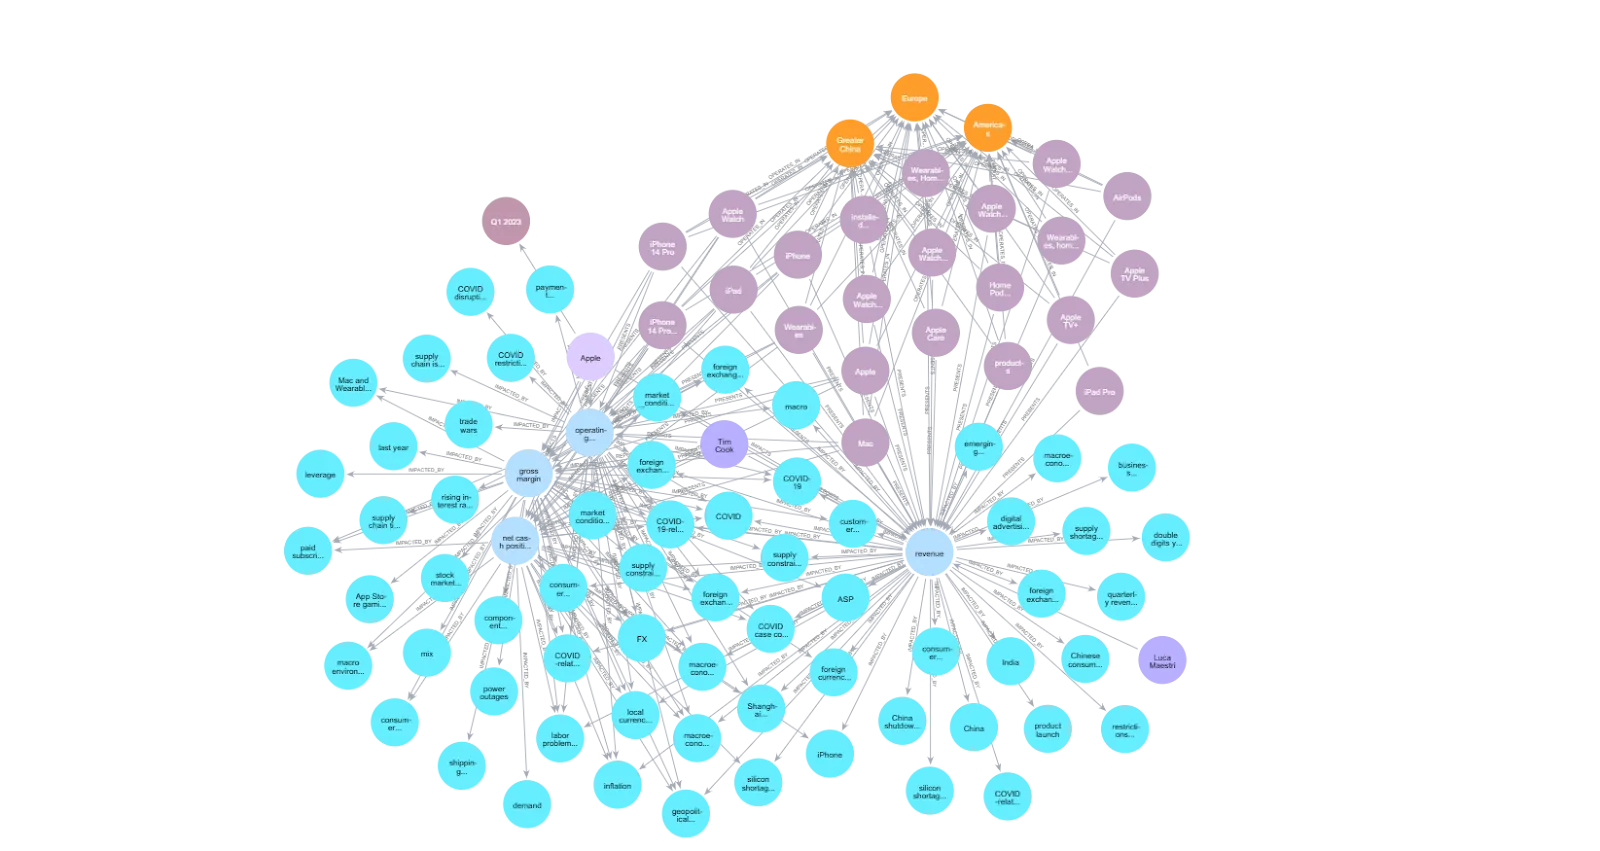
对于这类问题,WhyHow 的分块链接功能可以让我们同时使用节点和相应的分块,为 LLM 提供完整的上下文。
将深度和广度作为图搜索杠杆来增强矢量搜索
通过图搜索,广度和深度可被视为多代理系统中潜在的检索杠杆。协调代理可以对问题进行评估,以确定其检索是否需要更多的广度和/或深度。然后,可以使用离散范围(如 0.0-1.0)配置广度或深度级别,作为图查询的一部分。在横向(广度)或纵向(深度)遍历图时,可使用递归检索代理来帮助确定和进一步评估应保留和删除的内容。
这种特定类型的检索很难建立,尤其是仅靠矢量 RAG 就能以确定和准确的方式建立。这些类型的检索模式展示了使用图结构存储检索数据以及存储信息导航语义结构的新机遇。
是优化广度还是深度取决于具体的业务场景或执行查询的用户角色,并可根据其进行定制。例如,面向消费者的综合研究平台最初可能更关注广度搜索的优化,而当发现用户正在深入某个特定主题时,就会越来越关注深度搜索的优化。相比之下,律师使用的面向内部的法律 RAG 平台可能会从一开始就更多地针对深度搜索进行优化。还可以根据用户的风格和偏好,让搜索系统对广度或深度进行优化,从而实现 RAG 的个性化。
结论
图结构有助于为答案检索的广度和深度创建杠杆。通过一个现实世界中的金融分析示例,我们看到图结构在深度和广度上都为创建更完整的答案提供了更大的杠杆作用。此外,图结构还提供了一种语义一致、准确和确定的信息检索方式。将图结构与矢量搜索结合使用,可以实现高度确定性和完整的检索,这对企业工作流程至关重要。


