物体检测:如何检测小物体
物体检测是计算机视觉的基本任务之一。在高层次上,它涉及预测图像中物体的位置和类别。最先进的(SOTA)深度学习模型,如 “You-Only-Look-Once”(YOLO)系列中的模型,已经达到了非常高的准确度。然而,在物体检测领域,小物体是一个极具挑战性的领域。
在本文中,你将学习如何使用切片辅助超推理(SAHI)检测数据集中的小物体。
为什么检测小物体很难?
它们很小
首先,检测小物体之所以困难,是因为小物体太小了。物体越小,检测模型需要处理的信息就越少。如果一辆汽车在远处,它在我们的图像中可能只占几个像素。就像人类很难辨别远处的物体一样,我们的模型也很难识别没有车轮和车牌等可视特征的汽车!
训练数据
模型的好坏取决于其训练数据。大多数标准物体检测数据集和基准都侧重于中大型物体,这意味着大多数现成的物体检测模型都没有针对小型物体检测进行优化。
固定的输入尺寸
物体检测模型通常采用固定尺寸的输入。例如,YOLOv8 是在最大边长为 640 像素的图像上进行训练的。这意味着,当我们输入一张 1920x1080 大小的图像时,模型会在预测前将图像的采样率降低到 640x360,从而降低了分辨率,并忽略了小物体的重要信息。
SAHI 如何工作
理论上,你可以在更大的图像上训练模型,以提高对小物体的检测能力。但实际上,这需要更大的内存、更强的计算能力以及更耗费人力的数据集。
另一种替代方法是利用现有的物体检测技术,将模型应用于图像中固定大小的片段或切片,然后将结果拼接在一起。这就是切片辅助超推理背后的理念!
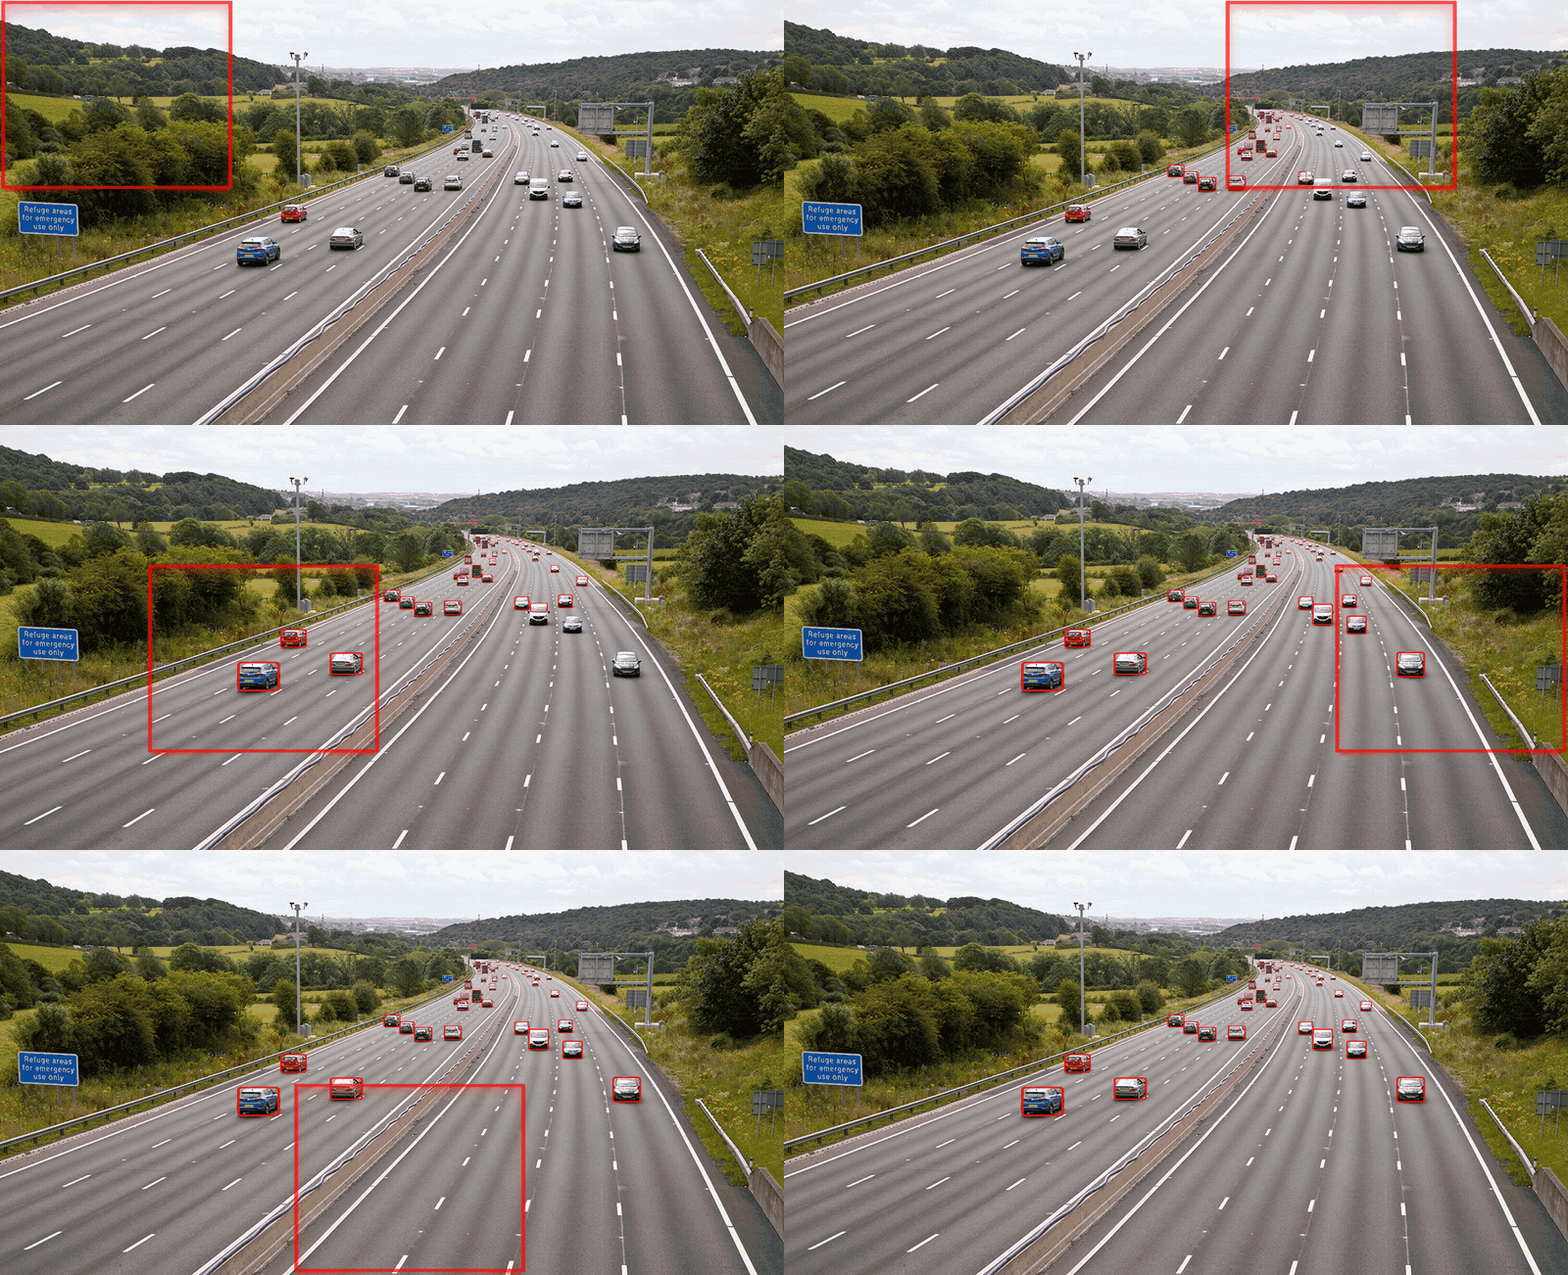
SAHI 的工作原理是将图像分割成完全覆盖图像的切片,然后使用指定的检测模型在每个切片上运行推理。然后将所有这些切片的预测结果合并在一起,生成整个图像的检测列表。SAHI 中的 “hyper ”来自于这样一个事实,即 SAHI 的输出不是模型推理的结果,而是涉及多个模型推理的计算结果。
SAHI 切片允许重叠(如上图中的 GIF 所示),这有助于确保至少有一个切片中有足够多的物体可以被检测到。
使用 SAHI 的关键优势在于它与模型无关。SAHI 可以利用当前的 SOTA 物体检测模型,也可以利用未来的任何 SOTA 模型!
当然,天下没有免费的午餐。作为 “超推理 ”的交换条件,除了将结果拼接在一起所需的处理外,你还需要对检测模型进行数倍的前向传递。
数据集设置
为了说明 SAHI 如何应用于检测小型物体,我们将使用中国天津大学机器学习与数据挖掘实验室 AISKYEYE 团队的 VisDrone 检测数据集。该数据集包含 8629 幅边长从 360 像素到 2000 像素不等的图像,是 SAHI 理想的测试平台。Ultralytics 的 YOLOv8l 将作为我们的基础对象检测模型。
我们将使用以下库:
- 用于数据集管理和可视化的 fiftyone
- huggingface_hub 用于从 Hugging Face Hub 加载 VisDrone 数据集
- 用于使用 YOLOv8 运行推理的 ultralytics,以及
- sahi 用于在图像切片上运行推理。
如果还没有安装,请安装这些库的最新版本。你需要 fiftyone>=0.23.8 才能从 Hugging Face Hub 加载 VisDrone:
pip install -U fiftyone sahi ultralytics huggingface_hub --quiet现在,在 Python 流程中,让我们导入 FiftyOne 模块,用于查询和管理我们的数据:
import fiftyone as fo
import fiftyone.zoo as foz
import fiftyone.utils.huggingface as fouh
from fiftyone import ViewField as F
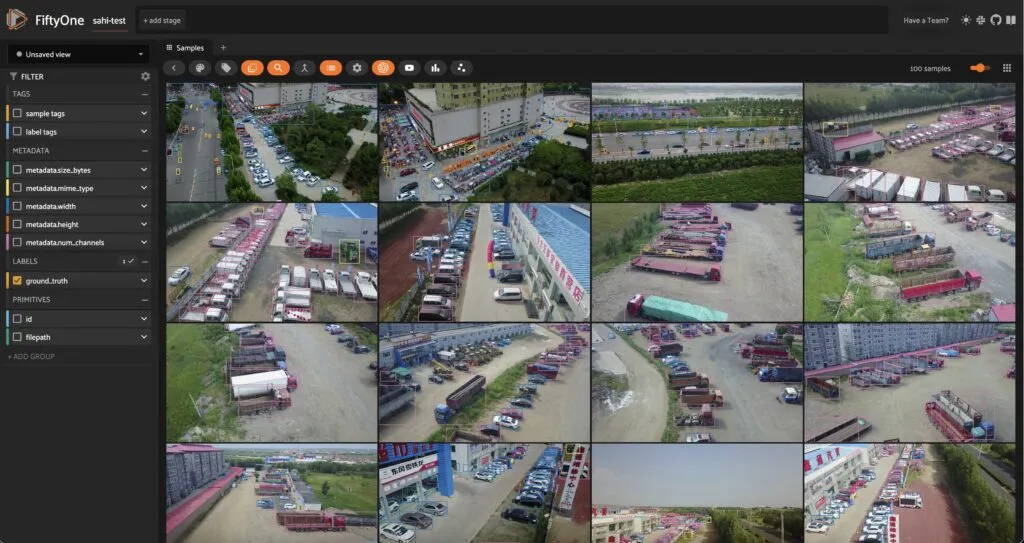
就这样,我们就可以加载数据了!我们将使用 FiftyOne's Hugging Face utils 中的 load_from_hub() 函数,通过其 repo_id 从 Hugging Face Hub 直接加载 VisDrone 数据集的一部分。为了进行演示并保持代码执行速度尽可能快,我们将只选取数据集中的前 100 张图像。我们还将把创建的新数据集命名为 “sahi-test”:
使用 YOLOv8 进行标准推断
我们将使用 SAHI 对数据进行超推理。在使用 SAHI 之前,我们先使用 Ultralytics 的 YOLOv8 模型的大型变体在数据上运行标准对象检测推理。
首先,我们创建一个 ultralytics.YOLO 模型实例,必要时下载模型检查点。然后,我们将此模型应用于数据集,并将结果存储在样本的 “base_model ”字段中:
from ultralytics import YOLO
ckpt_path = "yolov8l.pt"
model = YOLO(ckpt_path)
dataset.apply_model(model, label_field="base_model")
session.view = dataset.view()
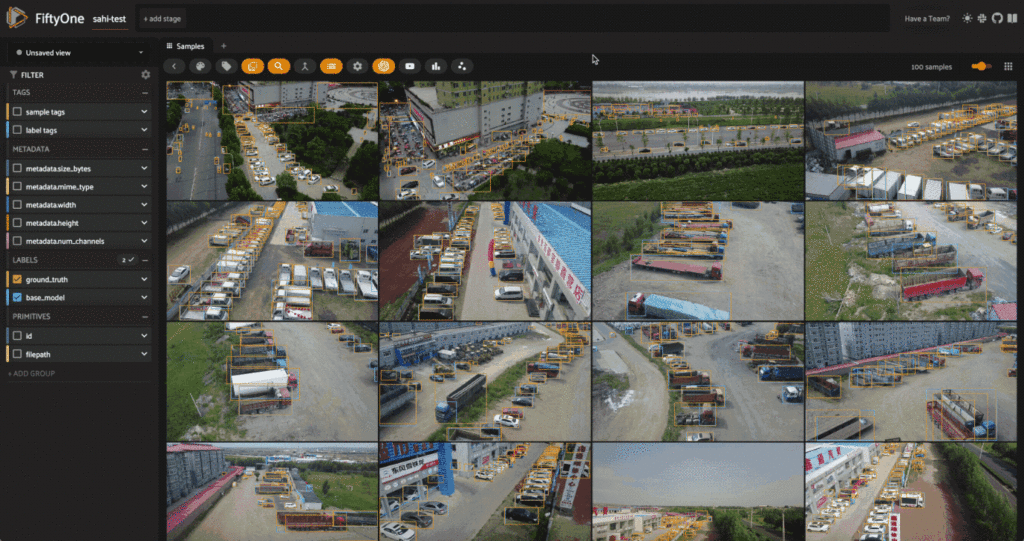
通过观察模型的预测结果和地面实况标签,我们可以发现一些问题。首先,我们的 YOLOv8l 模型检测到的类别与 VisDrone 数据集中的地面实况类别不同。我们的 YOLO 模型是在 COCO 数据集上训练的,该数据集有 80 个类别,而 VisDrone 数据集有 12 个类别,包括一个忽略区域类别。
为了简化比较,我们将只关注数据集中最常见的几个类,并将 VisDrone 类映射到 COCO 类如下:
mapping = {"pedestrians": "person", "people": "person", "van": "car"}"pedestrians": "person", "people": "person", "van": "car"}
mapped_view = dataset.map_labels("ground_truth", mapping)
然后过滤我们的标签,只包括我们感兴趣的类别:
def get_label_fields(sample_collection):
    """Get the (detection) label fields of a Dataset or DatasetView."""
    label_fields = list(
        sample_collection.get_field_schema(embedded_doc_type=fo.Detections).keys()
    )
    return label_fields
def filter_all_labels(sample_collection):
    label_fields = get_label_fields(sample_collection)
    filtered_view = sample_collection
    for lf in label_fields:
        filtered_view = filtered_view.filter_labels(
            lf, F("label").is_in(["person", "car", "truck"]), only_matches=False
        )
    return filtered_view
filtered_view = filter_all_labels(mapped_view)
session.view = filtered_view.view()
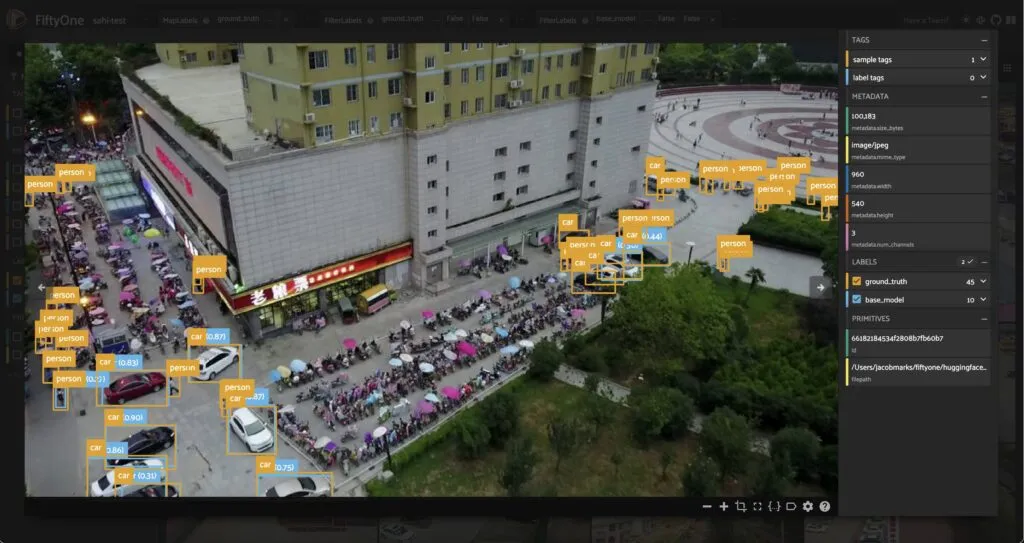
使用 SAHI 进行超推理
SAHI 技术是在我们之前安装的 sahi Python 软件包中实现的。SAHI 是一个与许多对象检测模型(包括 YOLOv8)兼容的框架。我们可以选择要使用的检测模型,并创建任何子类 sahi.models.DetectionModel 的实例,包括 YOLOv8、YOLOv5,甚至拥 Hugging Face Transformers 模型。
我们将使用 SAHI 的 AutoDetectionModel 类创建模型对象,指定模型类型和检查点文件的路径:
from sahi import AutoDetectionModel
from sahi.predict import get_prediction, get_sliced_prediction
detection_model = AutoDetectionModel.from_pretrained(
    model_type='yolov8',
    model_path=ckpt_path,
    confidence_threshold=0.25, ## same as the default value for our base model
    image_size=640,
    device="cpu", # or 'cuda' if you have access to GPU
)
在生成切片预测之前,让我们使用 SAHI 的 get_prediction()函数来检查模型对试验图像的预测结果:
result = get_prediction(dataset.first().filepath, detection_model)
print(result)
<sahi.prediction.PredictionResult object at 0x2b0e9c250>幸运的是,SAHI 结果对象有一个 to_fiftyone_detections() 方法,可以将结果转换为 FiftyOne 检测对象列表:
print(result.to_fiftyone_detections())[<Detection: {
'id': '661858c20ae3edf77139db7a',
'attributes': {},
'tags': [],
'label': 'car',
'bounding_box': [
0.6646394729614258,
0.7850866247106482,
0.06464214324951172,
0.09088355170355902,
],
'mask': None,
'confidence': 0.8933132290840149,
'index': None,
}>, <Detection: {
'id': '661858c20ae3edf77139db7b',
'attributes': {},
'tags': [],
'label': 'car',
'bounding_box': [
0.6196376800537109,
0.7399617513020833,
0.06670347849527995,
0.09494832356770834,
],
'mask': None,
'confidence': 0.8731599450111389,
'index': None,
}>, <Detection: {
....
....
....
这让我们的工作变得简单,从而可以专注于数据,而不是琐碎的格式转换细节。SAHI 的 get_sliced_prediction()函数与 get_prediction()函数的工作方式相同,只是多了几个超参数,让我们可以配置图像的切片方式。特别是,我们可以指定切片的高度和宽度,以及切片之间的重叠。下面是一个例子:
sliced_result = get_sliced_prediction(
    dataset.skip(40).first().filepath,40).first().filepath,
    detection_model,
    slice_height = 320,
    slice_width = 320,
    overlap_height_ratio = 0.2,
    overlap_width_ratio = 0.2,
)
作为初步检查,我们可以将切片预测中的检测数与原始预测中的检测数进行比较:
num_sliced_dets = len(sliced_result.to_fiftyone_detections())len(sliced_result.to_fiftyone_detections())
num_orig_dets = len(result.to_fiftyone_detections())
print(f"Detections predicted without slicing: {num_orig_dets}")
print(f"Detections predicted with slicing: {num_sliced_dets}")
Detections predicted without slicing: 17
Detections predicted with slicing: 73
我们可以看到,预测次数大幅增加!我们还需要确定新增的预测是有效的,还是只是出现了更多的误报。我们很快就会使用 FiftyOne 的评估 API 来完成这项工作。我们还想为切片找到一组好的超参数。我们需要对整个数据集应用 SAHI 来完成所有这些工作。让我们现在就开始吧!
为了简化过程,我们将定义一个函数,为指定标签字段中的样本添加预测值,然后遍历数据集,将函数应用到每个样本。该函数会将样本的文件路径和切片超参数传递给 get_sliced_prediction(),然后将预测结果添加到样本的指定标签字段中:
def predict_with_slicing(sample, label_field, **kwargs):
    result = get_sliced_prediction(
        sample.filepath, detection_model, verbose=0, **kwargs
    )
    sample[label_field] = fo.Detections(detections=result.to_fiftyone_detections())
我们将切片重叠固定在 0.2,然后看看切片高度和宽度对预测质量的影响:
kwargs = {"overlap_height_ratio": 0.2, "overlap_width_ratio": 0.2}"overlap_height_ratio": 0.2, "overlap_width_ratio": 0.2}
for sample in dataset.iter_samples(progress=True, autosave=True):
    predict_with_slicing(sample, label_field="small_slices", slice_height=320, slice_width=320, **kwargs)
    predict_with_slicing(sample, label_field="large_slices", slice_height=480, slice_width=480, **kwargs)
请注意,这些推理时间比原始推理时间要长得多。这是因为我们在每幅图像的多个切片上运行模型,这就增加了模型的前向传递次数。我们需要权衡利弊,以提高对小物体的检测能力。
现在,让我们再次过滤标签,只包含我们感兴趣的类别,并在 FiftyOne 应用程序中将结果可视化:
filtered_view = filter_all_labels(mapped_view)
session = fo.launch_app(filtered_view, auto=False)False)
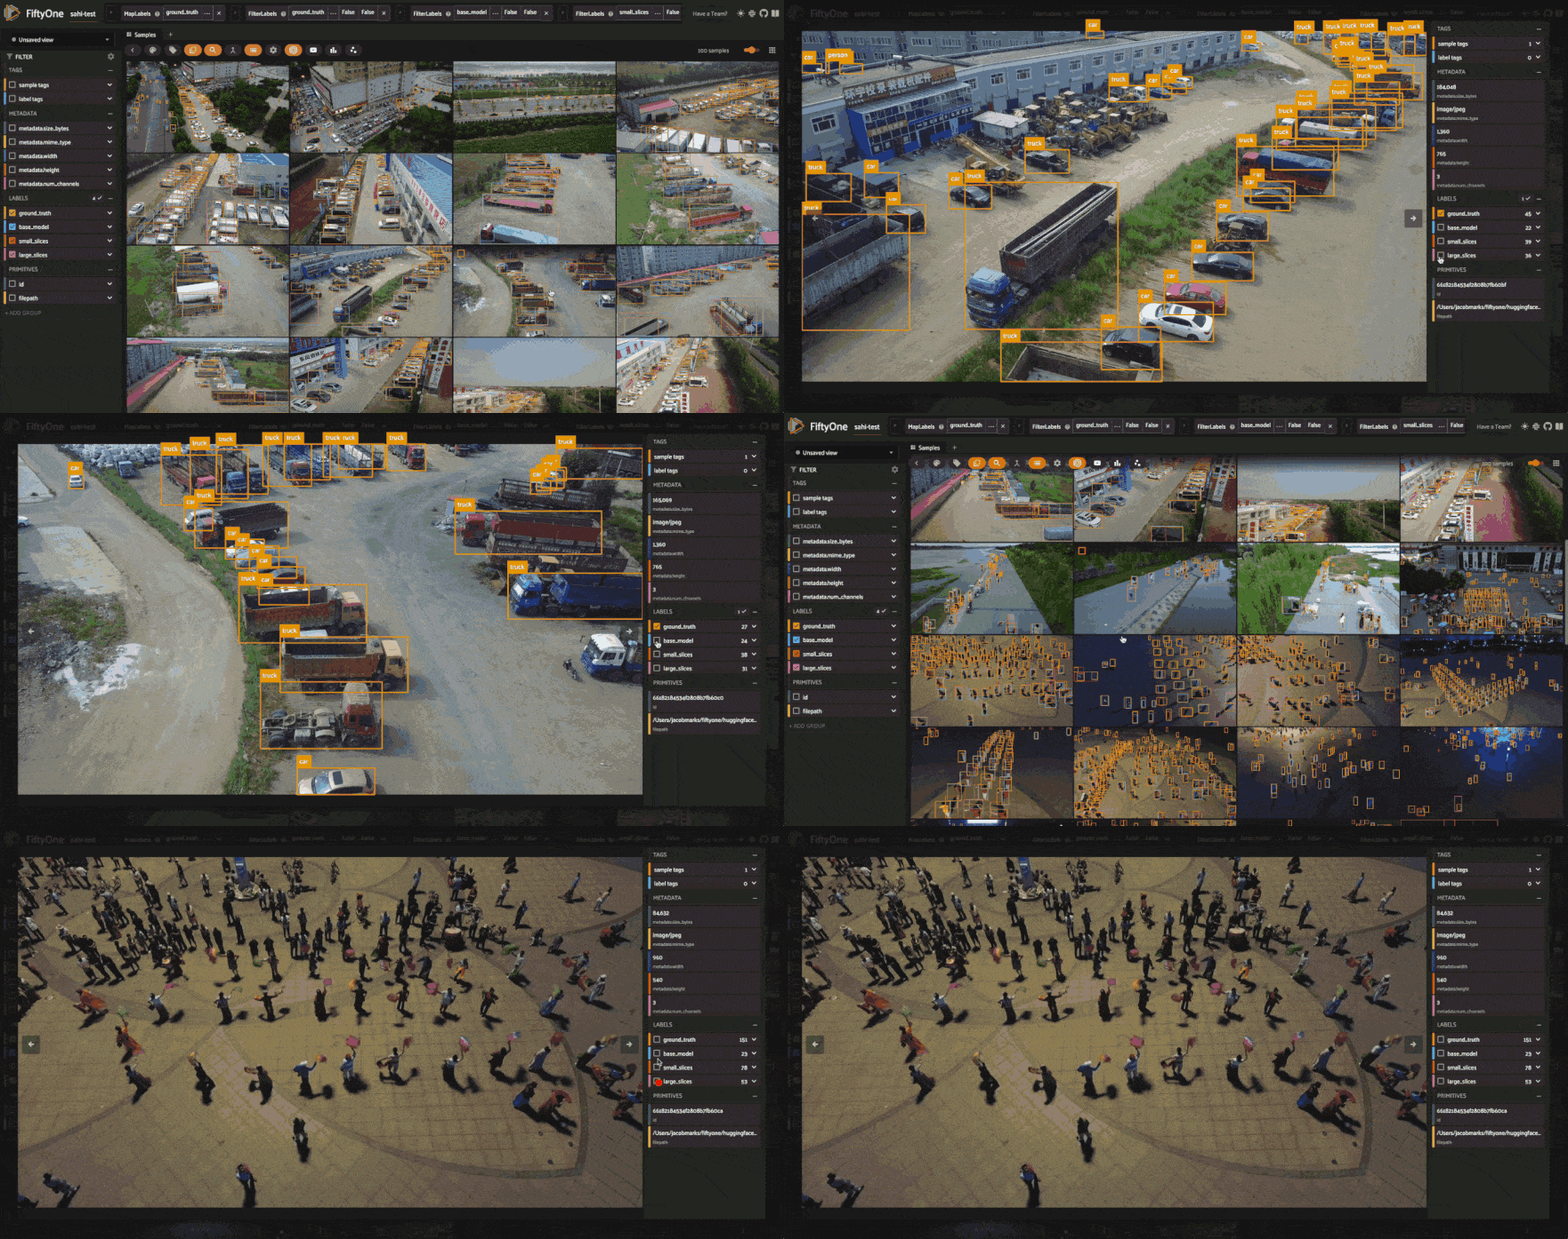
结果从一些可视化的例子来看,切片似乎提高了地面实况检测的覆盖率,尤其是较小的切片似乎能捕捉到更多的人物检测。但我们如何才能确定呢?让我们运行一个评估例程,将检测结果标记为真阳性、假阳性或假阴性,将切片预测结果与地面实况进行比较。我们将使用过滤视图的 evaluate_detections() 方法。
评估 SAHI 预测
继续使用数据集的过滤视图,让我们运行一个评估例程,将每个预测标签字段的预测结果与地面实况标签进行比较。这里,我们使用默认的 IoU 阈值 0.5,但也可以根据需要进行调整:
base_results = filtered_view.evaluate_detections("base_model", gt_field="ground_truth", eval_key="eval_base_model")"base_model", gt_field="ground_truth", eval_key="eval_base_model")
large_slice_results = filtered_view.evaluate_detections("large_slices", gt_field="ground_truth", eval_key="eval_large_slices")
small_slice_results = filtered_view.evaluate_detections("small_slices", gt_field="ground_truth", eval_key="eval_small_slices")
让我们分别打印一份报告:
print("Base model results:")
base_results.print_report()
print("-" * 50)
print("Large slice results:")
large_slice_results.print_report()
print("-" * 50)
print("Small slice results:")
small_slice_results.print_report()
Base model results:
              precision    recall  f1-score   support
         car       0.81      0.55      0.66       692
      person       0.94      0.16      0.28      7475
       truck       0.66      0.34      0.45       265
   micro avg       0.89      0.20      0.33      8432
   macro avg       0.80      0.35      0.46      8432
weighted avg       0.92      0.20      0.31      8432
--------------------------------------------------
Large slice results:
              precision    recall  f1-score   support
         car       0.67      0.71      0.69       692
      person       0.89      0.34      0.49      7475
       truck       0.55      0.45      0.49       265
   micro avg       0.83      0.37      0.51      8432
   macro avg       0.70      0.50      0.56      8432
weighted avg       0.86      0.37      0.51      8432
--------------------------------------------------
Small slice results:
              precision    recall  f1-score   support
         car       0.66      0.75      0.70       692
      person       0.84      0.42      0.56      7475
       truck       0.49      0.46      0.47       265
   micro avg       0.80      0.45      0.57      8432
   macro avg       0.67      0.54      0.58      8432
weighted avg       0.82      0.45      0.57      8432
我们可以看到,随着切片数量的增加,误报的数量也在增加,而误报的数量却在减少。这是意料之中的,因为模型能够通过更多的切片检测到更多的对象,但也会犯更多的错误!你可以采用更激进的置信度阈值来应对误报的增加,但即使不这样做,F1 分数也会显著提高。
让我们深入分析一下这些结果。我们在前面提到,该模型在处理小物体时比较吃力,因此我们来看看这三种方法在处理小于 32x32 像素的物体时效果如何。我们可以使用 FiftyOne 的 ViewField 进行过滤:
## Filtering for only small boxes
box_width, box_height = F("bounding_box")[2], F("bounding_box")[3]
rel_bbox_area = box_width * box_height
im_width, im_height = F("$metadata.width"), F("$metadata.height")
abs_area = rel_bbox_area * im_width * im_height
small_boxes_view = filtered_view
for lf in get_label_fields(filtered_view):
    small_boxes_view = small_boxes_view.filter_labels(lf, abs_area < 32**2, only_matches=False)
session.view = small_boxes_view.view()
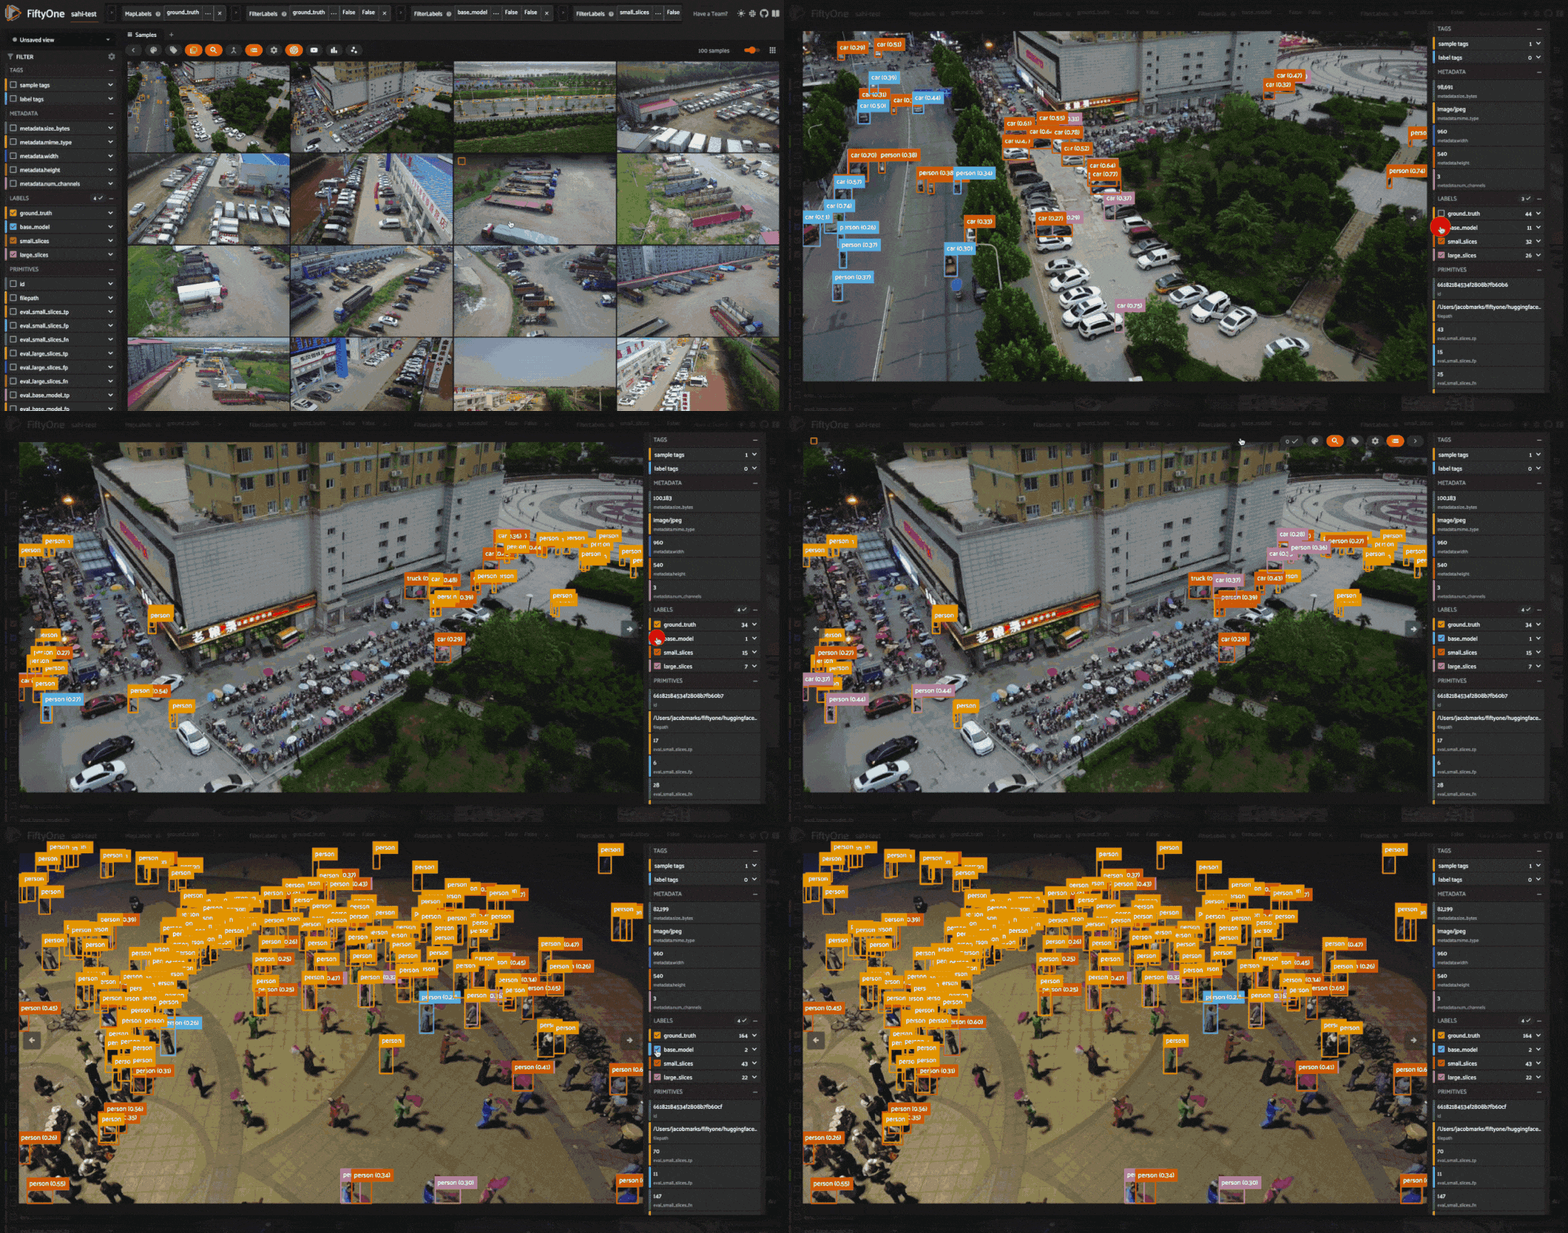
如果我们像以前一样在这些视图和打印报告上评估我们的模型,我们可以清楚地看到 SAHI 所提供的价值!使用 SAHI 时,小物体的召回率要高得多,而精度却没有明显下降,从而提高了 F1 分数。这一点在人物检测中尤为明显,F1 分数提高了两倍!
## Evaluating on only small boxes
small_boxes_base_results = small_boxes_view.evaluate_detections("base_model", gt_field="ground_truth", eval_key="eval_small_boxes_base_model")
small_boxes_large_slice_results = small_boxes_view.evaluate_detections("large_slices", gt_field="ground_truth", eval_key="eval_small_boxes_large_slices")
small_boxes_small_slice_results = small_boxes_view.evaluate_detections("small_slices", gt_field="ground_truth", eval_key="eval_small_boxes_small_slices")
## Printing reports
print("Small Box — Base model results:")
small_boxes_base_results.print_report()
print("-" * 50)
print("Small Box — Large slice results:")
small_boxes_large_slice_results.print_report()
print("-" * 50)
print("Small Box — Small slice results:")
small_boxes_small_slice_results.print_report()
Small Box — Base model results:
              precision    recall  f1-score   support
         car       0.71      0.25      0.37       147
      person       0.83      0.08      0.15      5710
       truck       0.00      0.00      0.00        28
   micro avg       0.82      0.08      0.15      5885
   macro avg       0.51      0.11      0.17      5885
weighted avg       0.82      0.08      0.15      5885
--------------------------------------------------
Small Box — Large slice results:
              precision    recall  f1-score   support
         car       0.46      0.48      0.47       147
      person       0.82      0.23      0.35      5710
       truck       0.20      0.07      0.11        28
   micro avg       0.78      0.23      0.36      5885
   macro avg       0.49      0.26      0.31      5885
weighted avg       0.80      0.23      0.36      5885
--------------------------------------------------
Small Box — Small slice results:
              precision    recall  f1-score   support
         car       0.42      0.53      0.47       147
      person       0.79      0.31      0.45      5710
       truck       0.21      0.18      0.19        28
   micro avg       0.75      0.32      0.45      5885
   macro avg       0.47      0.34      0.37      5885
weighted avg       0.77      0.32      0.45      5885
总结
在本文中,我们介绍了如何将 SAHI 预测添加到数据中,然后严格评估了切片对预测质量的影响。我们已经了解了切片辅助超推理(SAHI)如何提高检测的召回率和 F1 分数,尤其是对于小物体,而无需在大图像上训练模型。


