如何使用监督学习模型预测时间序列数据
本文通过使用开源库将时间序列数据集转换为表格格式,深入探讨了如何增强预测每日能源消耗水平的过程。我们探索了一种流行的多类分类模型的应用,并利用 AutoML 和 Cleanlab Studio 显著提高了样本外准确率。
本文给我们的主要启示是,通过将时间序列数据集转换为表格结构,我们可以利用更通用的方法对其进行建模,甚至还能在尝试预测这些时间序列数据时找到改进方法。
检查数据
该数据代表 PJM 每小时的能源消耗(以兆瓦为单位)。PJM Interconnection LLC (PJM) 是美国的一个区域传输组织 (RTO)。它是东部互连电网的一部分,运营着为许多州提供服务的输电系统。
让我们看一下我们的数据集。该数据包括一个日期时间列(object类型)和兆瓦能源消耗(float64)类型)列,我们试图将其预测为离散变量(对应于每小时能源消耗水平的四分位数)。我们的目标是训练一个时间序列预测模型,使其能够预测明天的每日能源消耗水平,分为 4 个级别之一:low、below average、above average或high(这些级别是根据总体每日消耗分布的四分位数确定的)。我们首先演示如何将 Prophet 等时间序列预测方法应用于此问题,但这些方法仅限于适合时间序列数据的某些类型的 ML 模型。接下来,我们演示如何将此问题重新构建为可以应用任何机器学习模型的标准多类分类问题,并展示如何通过使用强大的监督机器学习来获得卓越的预测。
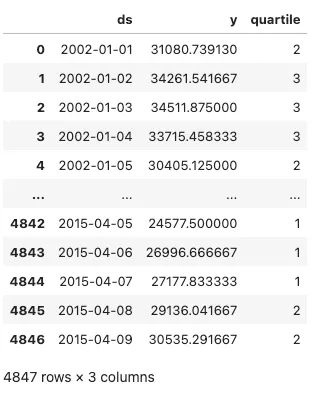
我们首先将这些数据转换为每日的平均能源消耗,并将各列重命名为 Prophet 预测模型期望的格式。这些实际值的每日能源消耗水平被转换为四分位数,这就是我们试图预测的值。我们的训练数据如下所示,以及每个每日能源消耗水平所属的四分位数。四分位数是使用训练数据计算的,以防止数据泄漏。
我们现在显示下面的训练数据,这是我们用来拟合预测模型的数据。

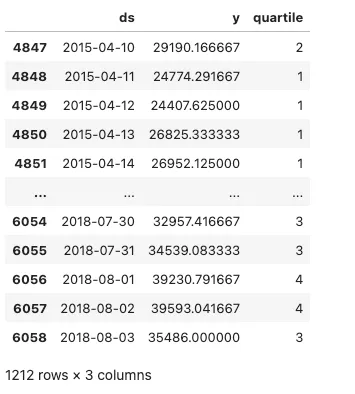
然后,我们将在下文中展示测试数据,也就是我们用来评估预测结果的数据。

训练和评估Prophet预测模型
如上图所示,我们将以 2015-04-09 作为训练数据的截止日期,并以 2015-04-10 作为测试数据的起始日期。我们仅使用训练数据计算每日能耗的四分位阈值。这就避免了数据泄漏--使用未来才能获得的样本外数据。
接下来,我们将预测测试数据期间 PJME 的日能耗水平(以兆瓦为单位),并将预测值表示为离散变量。该变量表示每日能源消耗水平的四分位数,可分为 1(低)、2(低于平均水平)、3(高于平均水平)或 4(高)。在评估方面,我们将使用 scikit-learn 的 accuracy_score 函数来评估模型的性能。由于我们是以这种方式提出问题的,因此我们可以使用分类准确率来评估模型的次日预测(并比较未来的模型)。
import numpy as np
from prophet import Prophet
from sklearn.metrics import accuracy_score
# Initialize model and train it on training data
model = Prophet()
model.fit(train_df)
# Create a dataframe for future predictions covering the test period
future = model.make_future_dataframe(periods=len(test_df), freq='D')
forecast = model.predict(future)
# Categorize forecasted daily values into quartiles based on the thresholds
forecast['quartile'] = pd.cut(forecast['yhat'], bins = [-np.inf] + list(quartiles) + [np.inf], labels=[1, 2, 3, 4])
# Extract the forecasted quartiles for the test period
forecasted_quartiles = forecast.iloc[-len(test_df):]['quartile'].astype(int)
# Categorize actual daily values in the test set into quartiles
test_df['quartile'] = pd.cut(test_df['y'], bins=[-np.inf] + list(quartiles) + [np.inf], labels=[1, 2, 3, 4])
actual_test_quartiles = test_df['quartile'].astype(int)
# Calculate the evaluation metrics
accuracy = accuracy_score(actual_test_quartiles, forecasted_quartiles)
# Print the evaluation metrics
print(f'Accuracy: {accuracy:.4f}')
>>> 0.4249
样本外准确率相当低,仅为 43%。通过这种方式建立时间序列模型,我们只能使用时间序列预测模型(可能的 ML 模型的有限子集)。
通过特征化将时间序列数据转换为表格数据
现在,我们将时间序列数据转换为表格格式,并使用开源库 sktime、tsfresh 和 tsfel 对数据进行特征化处理。通过使用这些库,我们可以提取大量的特征来捕捉时间序列数据的潜在模式和特征。这包括统计特征、时间特征和可能的频谱特征,它们提供了数据随时间变化的综合快照。通过将时间序列分解为单个特征,可以更容易地了解数据的不同方面是如何影响目标变量的。
TSFreshFeatureExtractor 是 sktime 库中的一个特征提取工具,它利用 tsfresh 的功能从时间序列数据中提取相关特征。在我们的用例中,我们利用 TSFreshFeatureExtractor 的最小和基本特征集来对数据进行特征化。
tsfel,即时间序列特征提取库,提供了一整套从时间序列数据中提取特征的工具。我们利用预定义配置,从能源消耗时间序列数据中构建了丰富的特征集(如统计、时间、频谱),捕捉了可能与我们的分类任务相关的各种特征。
import tsfel
from sktime.transformations.panel.tsfresh import TSFreshFeatureExtractor
# Define tsfresh feature extractor
tsfresh_trafo = TSFreshFeatureExtractor(default_fc_parameters="minimal")
# Transform the training data using the feature extractor
X_train_transformed = tsfresh_trafo.fit_transform(X_train)
# Transform the test data using the same feature extractor
X_test_transformed = tsfresh_trafo.transform(X_test)
# Retrieves a pre-defined feature configuration file to extract all available features
cfg = tsfel.get_features_by_domain()
# Function to compute tsfel features per day
def compute_features(group):
    # TSFEL expects a DataFrame with the data in columns, so we transpose the input group
    features = tsfel.time_series_features_extractor(cfg, group, fs=1, verbose=0)
    return features

# Group by the 'day' level of the index and apply the feature computation
train_features_per_day = X_train.groupby(level='Date').apply(compute_features).reset_index(drop=True)
test_features_per_day = X_test.groupby(level='Date').apply(compute_features).reset_index(drop=True)
# Combine each featurization into a set of combined features for our train/test data
train_combined_df = pd.concat([X_train_transformed, train_features_per_day], axis=1)
test_combined_df = pd.concat([X_test_transformed, test_features_per_day], axis=1)
接下来,我们通过删除与我们的目标变量--日均能耗水平--相关性较高(高于 0.8)的特征以及相关性为空的特征来清理数据集。高相关特征可能会导致过拟合,即模型在训练数据上表现良好,但在未见数据上表现不佳。另一方面,空相关特征则没有任何价值,因为它们与目标缺乏可定义的关系。
通过排除这些特征,我们旨在提高模型的泛化能力,并确保我们的预测是基于一组均衡而有意义的数据输入。
# Filter out features that are highly correlated with our target variable
column_of_interest = "PJME_MW__mean"
train_corr_matrix = train_combined_df.corr()
train_corr_with_interest = train_corr_matrix[column_of_interest]
null_corrs = pd.Series(train_corr_with_interest.isnull())
false_features = null_corrs[null_corrs].index.tolist()
columns_to_exclude = list(set(train_corr_with_interest[abs(train_corr_with_interest) > 0.8].index.tolist() + false_features))
columns_to_exclude.remove(column_of_interest)
# Filtered DataFrame excluding columns with high correlation to the column of interest
X_train_transformed = train_combined_df.drop(columns=columns_to_exclude)
X_test_transformed = test_combined_df.drop(columns=columns_to_exclude)
如果我们现在看一下训练数据的前几行,这就是它的一个快照。我们现在有 73 个特征,这些特征是从我们使用的时间序列特征库中添加的。根据这些特征,我们要预测的标签是第二天的能耗水平。

值得注意的是,我们采用的最佳做法是对训练数据和测试数据分别进行特征化处理,以避免数据泄漏(保留的测试数据是我们最近的观测数据)。
此外,我们使用以下代码计算离散四分位值(使用我们最初定义的四分位值),以获得训练/测试能量标签,也就是我们的 y_labels。
# Define a function to classify each value into a quartile
def classify_into_quartile(value):
    if value < quartiles[0]:
        return 1
    elif value < quartiles[1]:
        return 2
    elif value < quartiles[2]:
        return 3
    else:
        return 4
y_train = X_train_transformed["PJME_MW__mean"].rename("daily_energy_level")
X_train_transformed.drop("PJME_MW__mean", inplace=True, axis=1)
y_test = X_test_transformed["PJME_MW__mean"].rename("daily_energy_level")
X_test_transformed.drop("PJME_MW__mean", inplace=True, axis=1)
energy_levels_train = y_train.apply(classify_into_quartile)
energy_levels_test = y_test.apply(classify_into_quartile)
在特征化表格数据上训练和评估梯度提升分类器模型
使用特征化表格数据集,我们可以应用任何有监督的 ML 模型来预测未来的能耗水平。在这里,我们将使用梯度提升分类器(GBC)模型,它是大多数数据科学家处理表格数据的首选武器。
我们的 GBC 模型由 sklearn.ensemble 模块实例化,并配置了特定的超参数,以优化其性能并避免过度拟合。
from sklearn.ensemble import GradientBoostingClassifier
gbc = GradientBoostingClassifier(
    n_estimators=150,
    learning_rate=0.1,
    max_depth=4,
    min_samples_leaf=20,
    max_features='sqrt',
    subsample=0.8,
    random_state=42
)
gbc.fit(X_train_transformed, energy_levels_train)

y_pred_gbc = gbc.predict(X_test_transformed)
gbc_accuracy = accuracy_score(energy_levels_test, y_pred_gbc)
print(f'Accuracy: {gbc_accuracy:.4f}')
>>> 0.8075
81% 的样本外准确率大大高于我们之前的先知模型结果。
使用 AutoML 简化流程
既然我们已经了解了如何将时间序列问题特征化,以及应用梯度提升等强大 ML 模型的好处,那么一个自然而然的问题就出现了: 我们应该应用哪种有监督的 ML 模型呢?当然,我们可以尝试多种模型,调整它们的超参数,然后将它们集合在一起。一个更简单的解决方案是让 AutoML 为我们处理所有这些问题。
在这里,我们将使用 Cleanlab Studio 提供的一个简单的 AutoML 解决方案,它不需要任何配置。我们只需提供表格数据集,该平台就会自动训练多种类型的监督 ML 模型(包括梯度提升等),调整它们的超参数,并确定哪些模型最适合组合成单一预测器。以下是训练和部署 AutoML 监督分类器所需的全部代码:
from cleanlab_studio import Studio
studio = Studio()
studio.create_project(
    dataset_id=energy_forecasting_dataset,
    project_name="ENERGY-LEVEL-FORECASTING",
    modality="tabular",
    task_type="multi-class",
    model_type="regular",
    label_column="daily_energy_level",
)
model = studio.get_model(energy_forecasting_model)
y_pred_automl = model.predict(test_data, return_pred_proba=True)
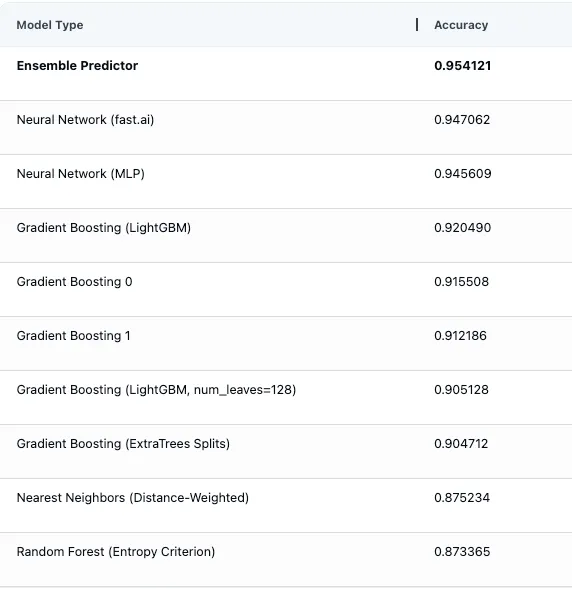
下面我们可以看到 AutoML 平台中的模型评估估计值,显示了自动拟合和评估的所有不同类型的 ML 模型(包括多个梯度提升模型),以及通过优化组合这些模型的预测结果而构建的集合预测器。

在对测试数据进行推理以获得第二天的能耗水平预测后,我们发现测试准确率为 89%,与之前的梯度提升方法相比,原始准确率提高了 8%。

结论
对于我们的 PJM 日常能源消耗数据,我们发现将数据转换为表格格式并对其进行特征化处理后,预测误差比我们使用先知预测模型建立的基准准确率降低了 67%(样本外准确率的原始百分点提高了 38%)。
通过采用上述方法对时间序列数据集进行建模,超越了只考虑预测方法的局限性,我们可以应用更通用的有监督 ML 技术,并在某些类型的预测问题上取得更好的结果。


